The Quant Case for Power
For speculative trading & market-making firms
Wholesale US electricity markets represent a compelling frontier for quantitative and speculative trading firms currently active in traditional commodity derivatives. The case rests on three structural features of power markets — fragmentation, inelastic supply and demand, and timing — and on an empirical finding: power volatility dwarfs that of established commodity markets.
Executive summary
This paper, published by ElectronX ("EXI"), the first US-regulated, direct-access power derivatives exchange, makes the case that wholesale US electricity markets represent a compelling frontier for quantitative and speculative trading firms currently active in traditional commodity derivatives.
The argument rests on three structural features of power markets. First, fragmentation: US wholesale power is governed by multiple Independent System Operators and Regional Transmission Operators, each with distinct pricing methodologies, data dissemination practices, and settlement timelines. This heterogeneity creates structural inefficiencies for firms willing to invest in multi-grid trading infrastructure. Second, inelastic supply and demand: unlike oil and gas markets populated by sophisticated speculators, power market flows are dominated by structurally driven hedging from load-serving entities obligated to balance supply and demand in real time, and electricity's storage difficulty amplifies pricing dislocations. Third, timing: power's diurnal load cycle is driven by weather and consumption patterns rather than trader behaviour, making volatility windows forecastable with high accuracy.
The core empirical finding, drawn from a three-year comparison (2023–2025) of ERCOT North Hub hourly real-time prices against hourly NYMEX crude oil and natural gas futures prices, is that power volatility dwarfs that of established commodity markets. ERCOT exhibits dramatically higher kurtosis, far more frequent extreme (5- and 10-sigma) price moves, and aggregate annual absolute price movement of roughly $131,000 per MWh unit for just a single hub.
ElectronX positions itself as the solution through three differentiators: hourly contract granularity for precision hedging and targeted speculation, bounded derivative products that cap tail-risk exposure across different volatility regimes, and a cloud-native, latency-insensitive platform architecture that levels the playing field relative to the hardware-intensive infrastructure of traditional exchanges.
Introduction
Wholesale power prices can be extremely volatile intraday, which creates the need for an exchange offering granular hedging solutions to institutional power traders and, consequently, a thematically compelling source of commodity returns for speculative traders. ElectronX is the first US-regulated, direct-access power derivatives exchange in the US, built specifically to meet these needs. By aggregating liquidity from multiple classes of market participant, it offers convenient hedging for physically exposed wholesale market participants and an efficient price formation process for speculative traders. This document is intended for speculative trading and market-making houses already commanding considerable portions of average daily volume (ADV) and open interest (OI) in established commodity derivatives markets, and evaluating US power markets as a potential area for expansion.
To support the position that power should be the next candidate for expansion, this document compares one of the most active spot trading markets in US power — the Electric Reliability Council of Texas (ERCOT) North Hub real-time market — with two mature commodity derivatives markets: NYMEX Crude Oil (CL) futures and Henry Hub Natural Gas (NG) OI-based continuous front-month contracts, over a three-year sample from 1 January 2023 through 31 December 2025.
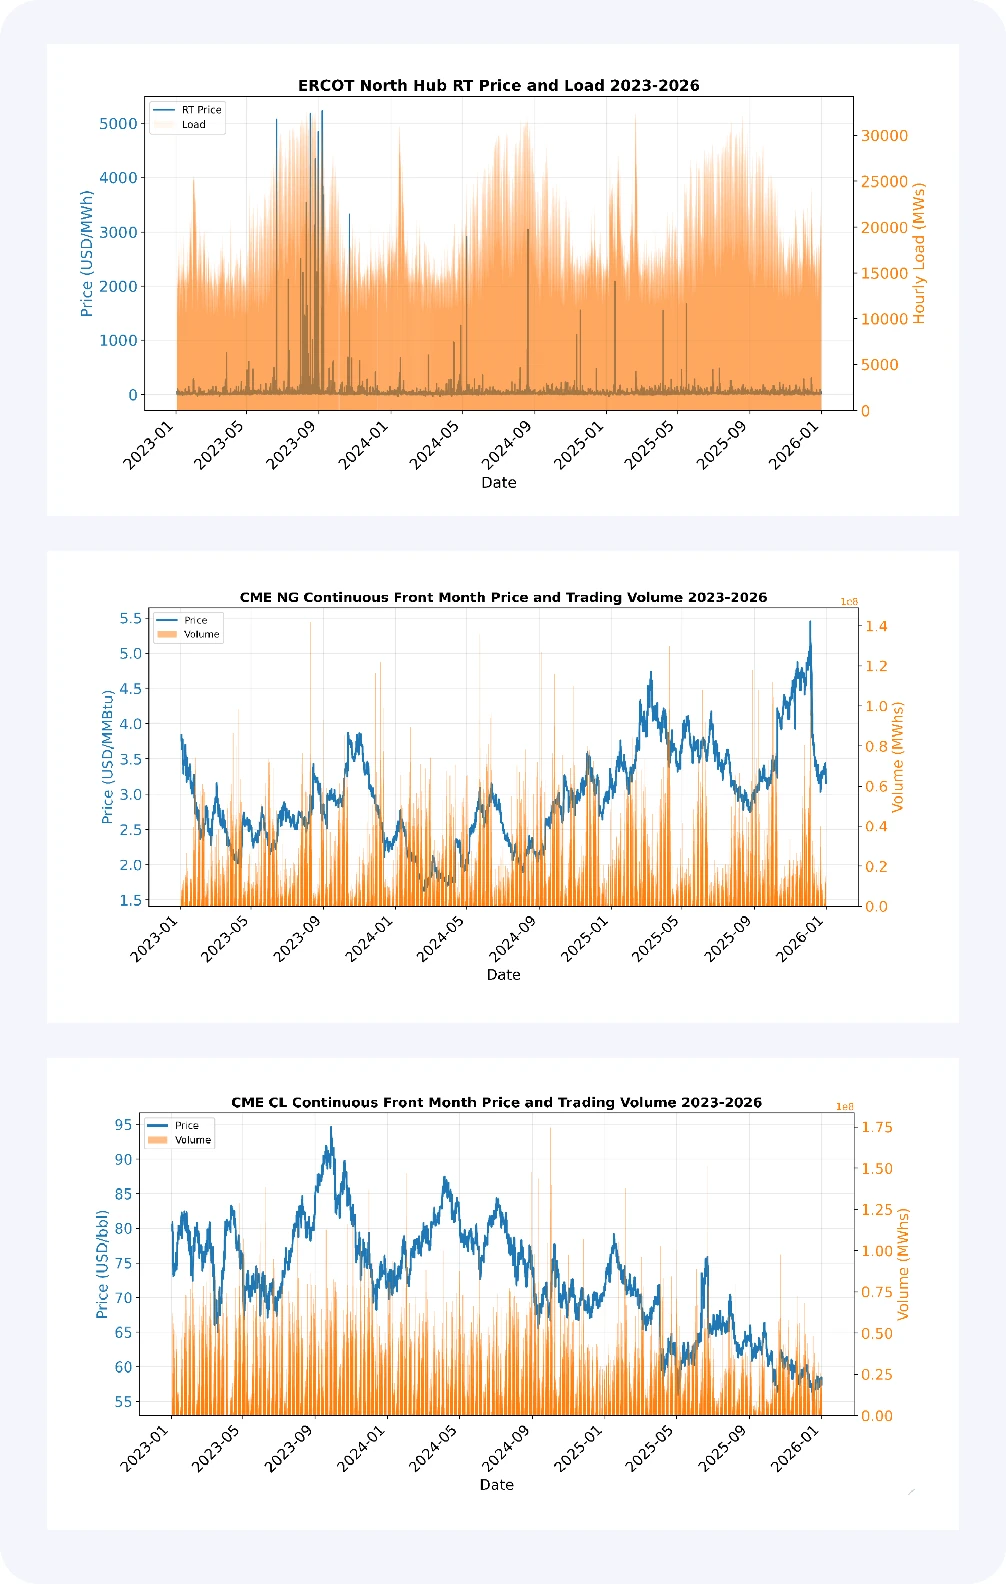
The rules: power market structure
Price action in power markets is driven by three core pillars, all of which should be familiar to systematic traders as reliable sources of informational asymmetry: fragmentation, elasticities of supply, and timing.
Fragmentation — regulation
The clearing of load — the demand for power — in the wholesale market is regional and heterogeneous. The physical supply of power is largely regulated by the Federal Energy Regulatory Commission (FERC), which delegates to Regional Transmission Operators (RTOs) such as PJM Interconnection, the Midcontinent Independent System Operator (MISO), and the New York Independent System Operator (NYISO) to own, operate, and balance the electrical grids in their jurisdictions. Texas's grid is managed independently of FERC's jurisdiction by ERCOT.
Fragmentation — Locational Marginal Pricing
Within each RTO, pricing is determined on a locational basis — Locational Marginal Pricing (LMP) — at a variety of granularities: from individual physical assets connected to the grid such as generators or batteries, referred to as nodes, to interfaces, the pricing gateways for power flowing into and out of an RTO, up to regional weighted aggregates of nodal pricing such as zones or hubs. Hub-level aggregates are the current locational granularity at which ElectronX lists contracts.
The prices themselves are determined by the output of Security Constrained Economic Dispatch (SCED) and Security Constrained Unit Commitment (SCUC) engines — complementary optimisation engines used by each RTO to dispatch generating resources according to the minimum cost of delivering the next MW of power to the grid. The SCUC engine assigns load-serving resources eligibility for dispatch, typically running once a day, while the SCED engine executes at higher frequency, roughly every five minutes, activating and deactivating eligible resources to match excess load or reduce excess generation. The results are then made available to the public.
The LMPs for each location as reported by the RTO are used by ElectronX to determine the final settlement price for its derivatives contracts, and are functionally the spot price of power for each location in the US. A full description of ElectronX's settlement methodologies for each RTO and trading location is available at electronx.com/products.
Fragmentation — heterogeneity
In a perfect world the organisation of these disparate regional markets would rely on the same pricing mechanisms, collateral requirements, trading technologies, and locational definitions. In practice that uniformity does not exist across wholesale US power markets. While each RTO's methodologies are not fully orthogonal, each differentiates its definition, determination, and dissemination of pricing just enough to require considerable time and technology investment to manage trading operations across multiple grids simultaneously.
ERCOT, for example, reliably produces and distributes settlement-quality LMPs every five minutes, which are load-weight averaged into Settlement Point Prices (SPPs) and then arithmetically averaged by ElectronX for the final settlement price of each hourly contract. PJM similarly produces five-minute real-time prices, averaged arithmetically without load-weighting into hourly LMPs. These intraday-reported LMPs are not settlement quality: PJM will not use them to settle real-time transactions from Load Serving Entities and end users. Revised settlement prices are available on a T+1 basis, and while they often match the previous day's unverified prices, grid integrity issues or extreme weather events have historically produced large revisions — and consequently significant revisions to a spot trader's P&L. Real-time pricing is distributed publicly at each RTO's discretion, at best via near-real-time APIs such as PJM's dataminer2.pjm.com.
Elasticities of supply
Commercial participants in spot power markets are functionally hedgers with inelastic behaviour. Power is also not easily stored, unlike traditional commodities, which necessitates near-instantaneous activation and deactivation of generation resources to balance real-time generation with load at all times and in all market conditions. To participate in any US RTO, asset-backed physical power traders are obligated to serve load when dispatched by the SCED and SCUC engines described above. These commercial traders trade futures to hedge their load forecasts and asset operating costs — not because they believe the forward curve is misshapen or a particular strip looks cheap. Those hedgers create systematic, predictable flows that are structurally driven rather than informationally driven. Unlike oil and gas markets, which consist mostly of sophisticated speculators with flat-price or spread views and hardened hedgers who have adopted similarly sophisticated pricing and risk techniques to compete with that mature speculator flow, the vast majority of power flow is driven by inelastic hedging activity.
Timing
In crude and natural gas derivatives markets, the well-documented intraday volume "smiles" reflect the periodicity of speculative and hedging decisions: related financial markets open in the US morning, fundamental reports from the EIA and API are released, new information on geopolitical events and exploratory projects is injected into prices and models, and fixed daily settlement windows draw considerable volume as large OI holders mark inventories. The shape of those volume curves is a behavioural artefact of institutional rhythms — in oil and gas, the volume curve is the participation curve.
In spot power, the analogue to traded volume is system load, which is not a participation curve but a consumption curve, driven by thermostats, industrial schedules, and daylight. Millions of residents deciding to turn on the air conditioning on a hot summer evening is not a price-conscious decision. In aggregate these behaviours create a diurnal load cycle — a morning ramp, an afternoon peak, and an evening decline — that repeats daily and is predictable hours in advance. The inelasticities of supply and the 24/7 continuity of spot power create a load curve flatter and smoother than a futures volume curve, because it is driven by physics and regulatory obligation rather than conscious trading decisions.
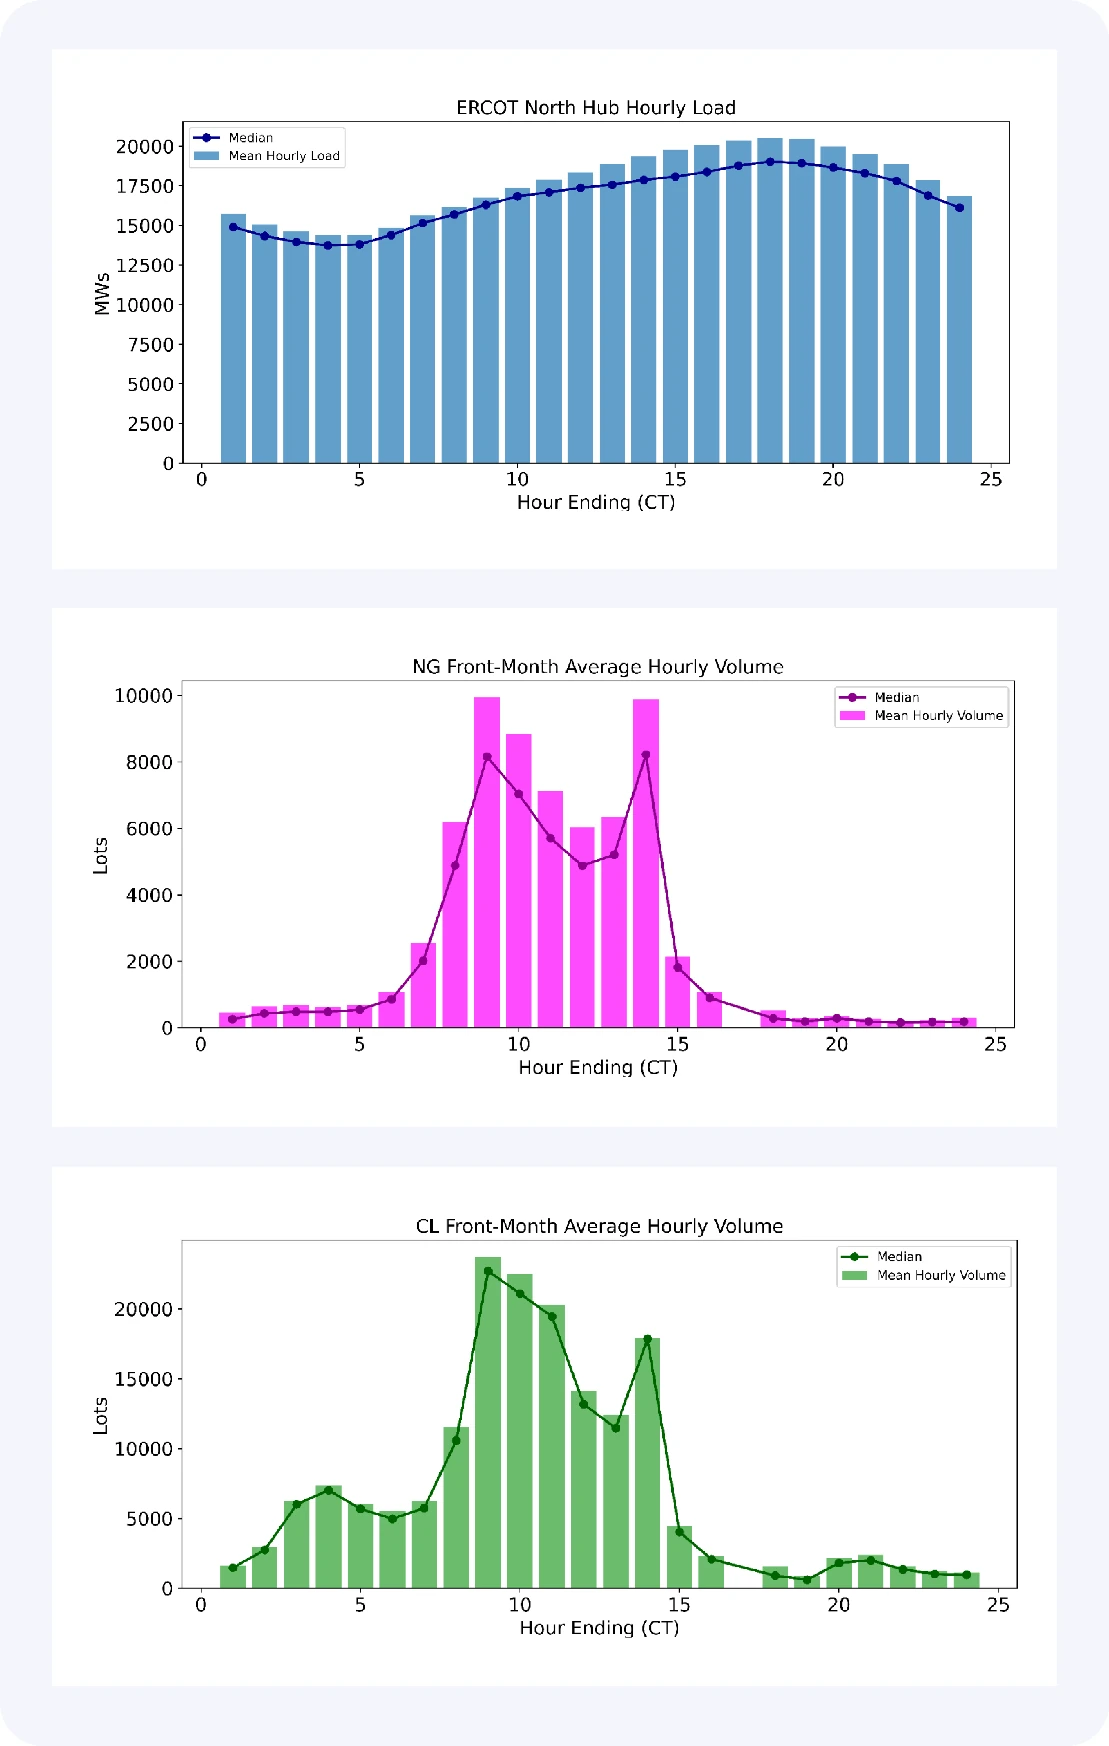
The confluence of these factors makes for power's most fearsome trait: volatility.
The opportunity: volatility
A direct measure of price variability in any market is the magnitude of price movement per unit of exposure. The figure below compares the average absolute hourly price change — the simplest possible measure of how much each market moves per hour — across ERCOT's North Hub real-time market and NYMEX's continuous front-month CL and NG contracts.
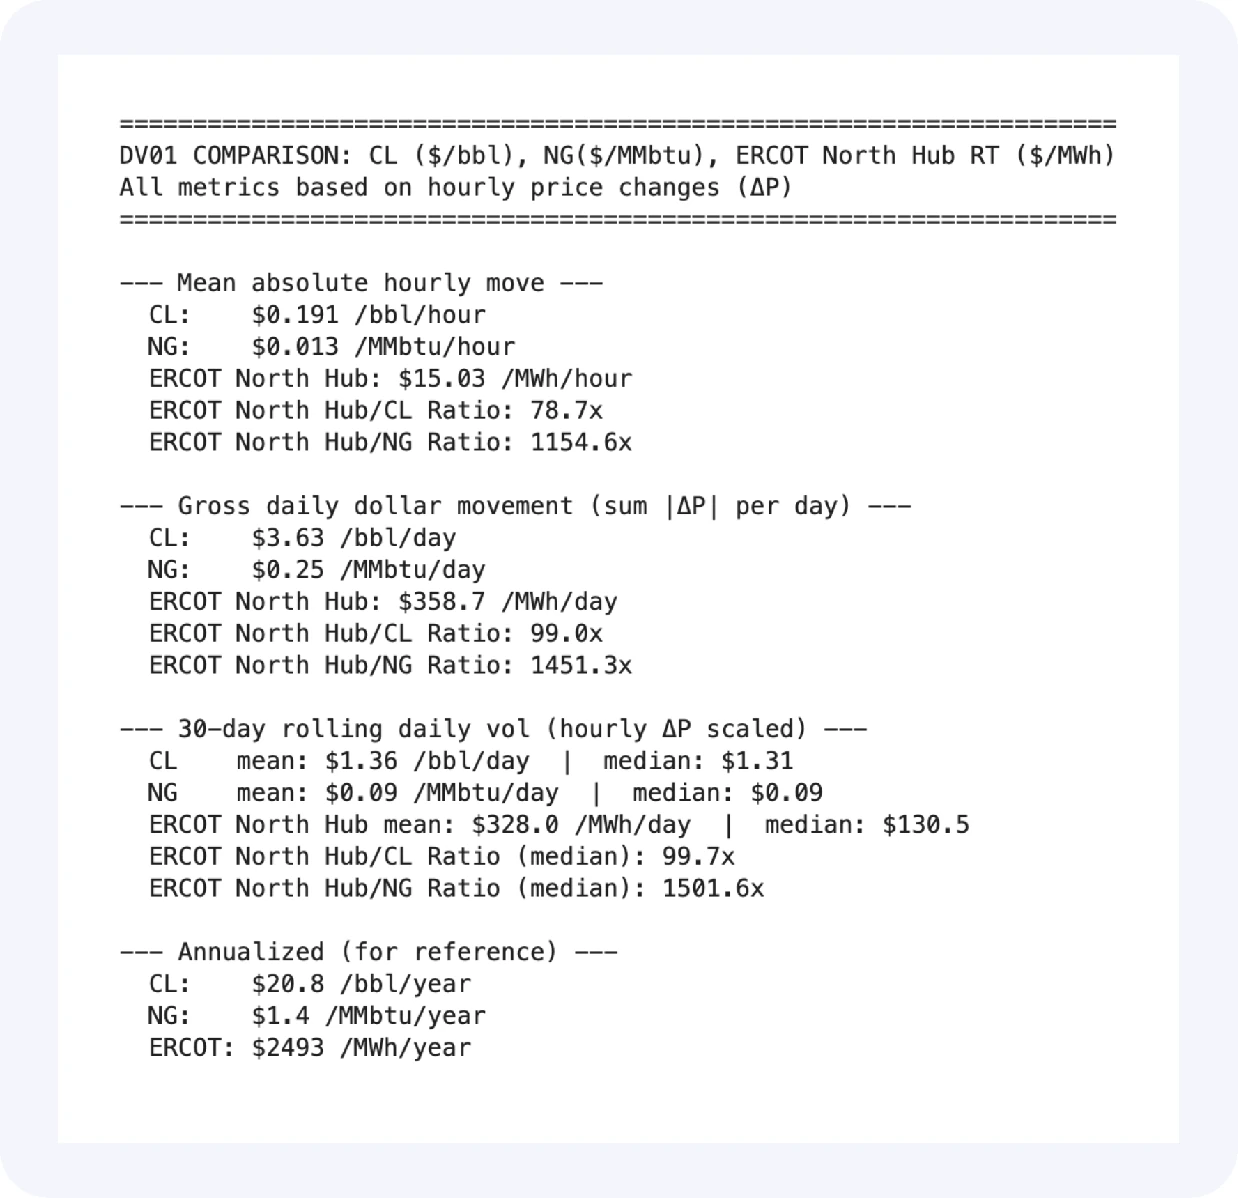
The disparity in gross daily dollar movement per notional unit is not driven by a few outlier days. The chart below shows the width of hourly ERCOT North Hub pricing across the sample period for each hour ending (HE), with bands marking the 10th and 90th percentile range.
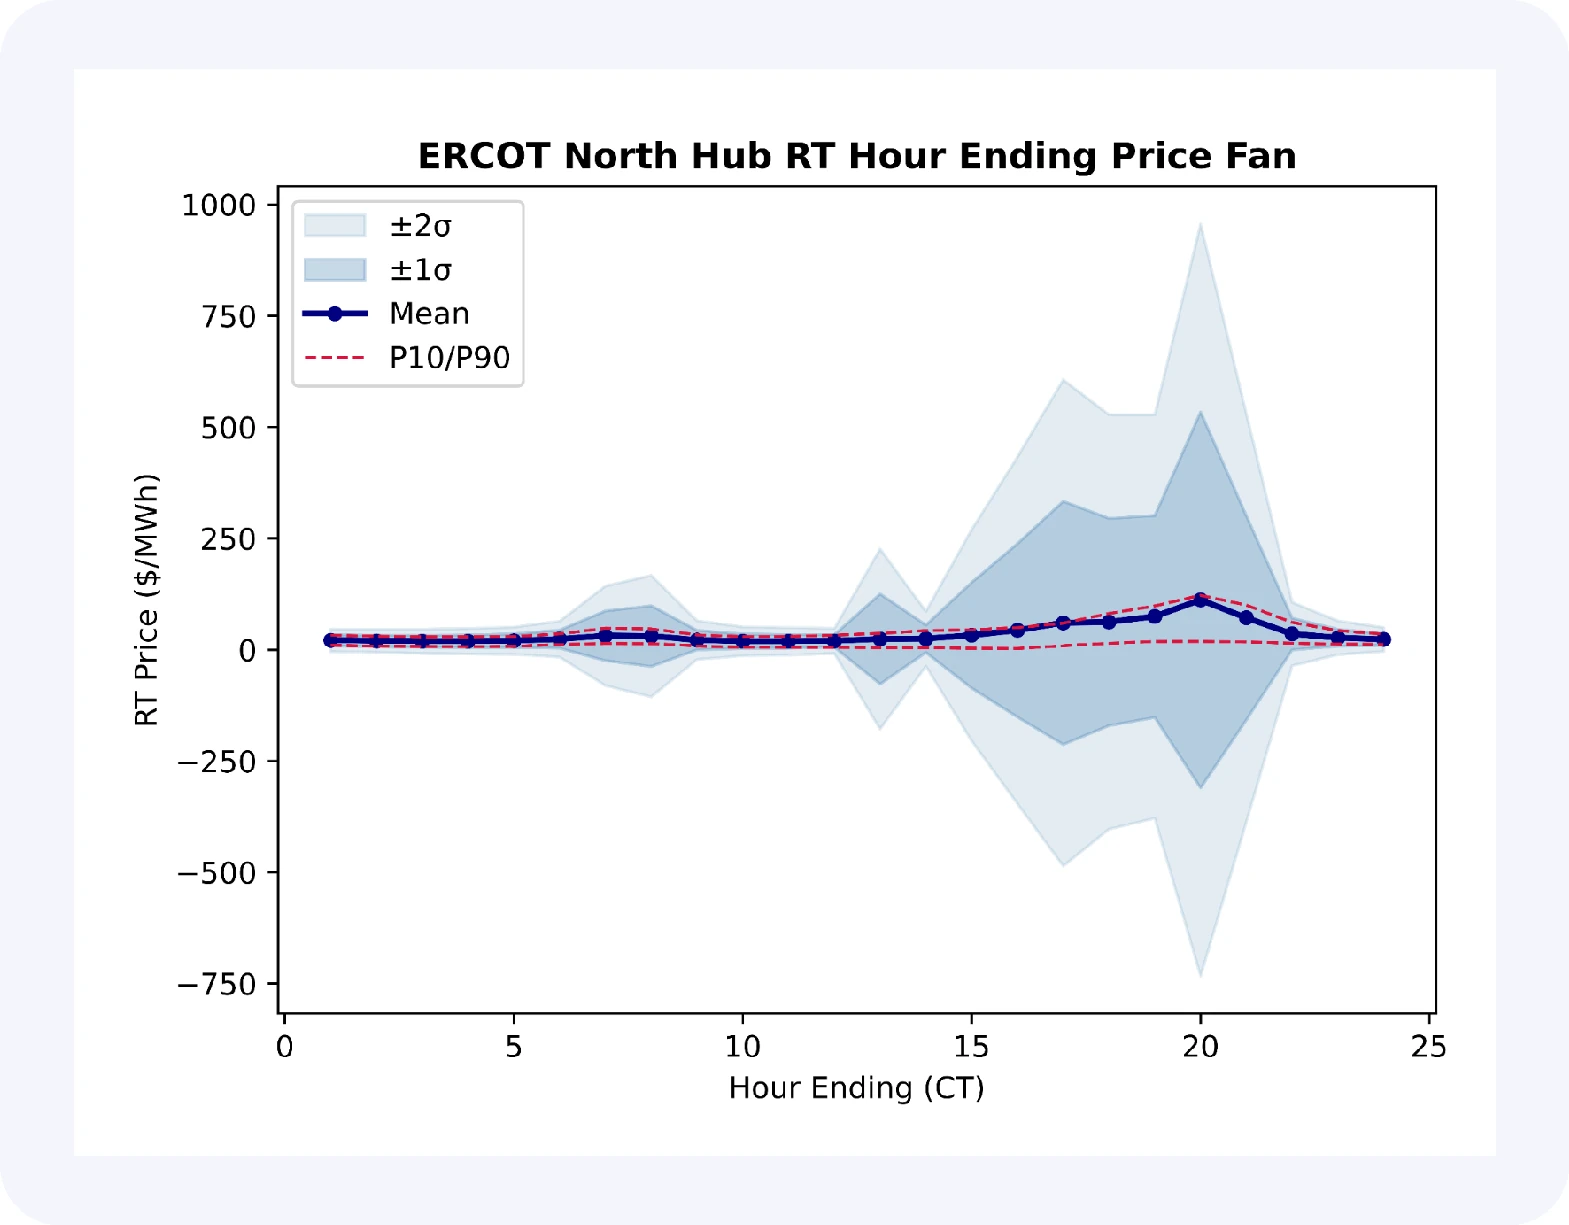
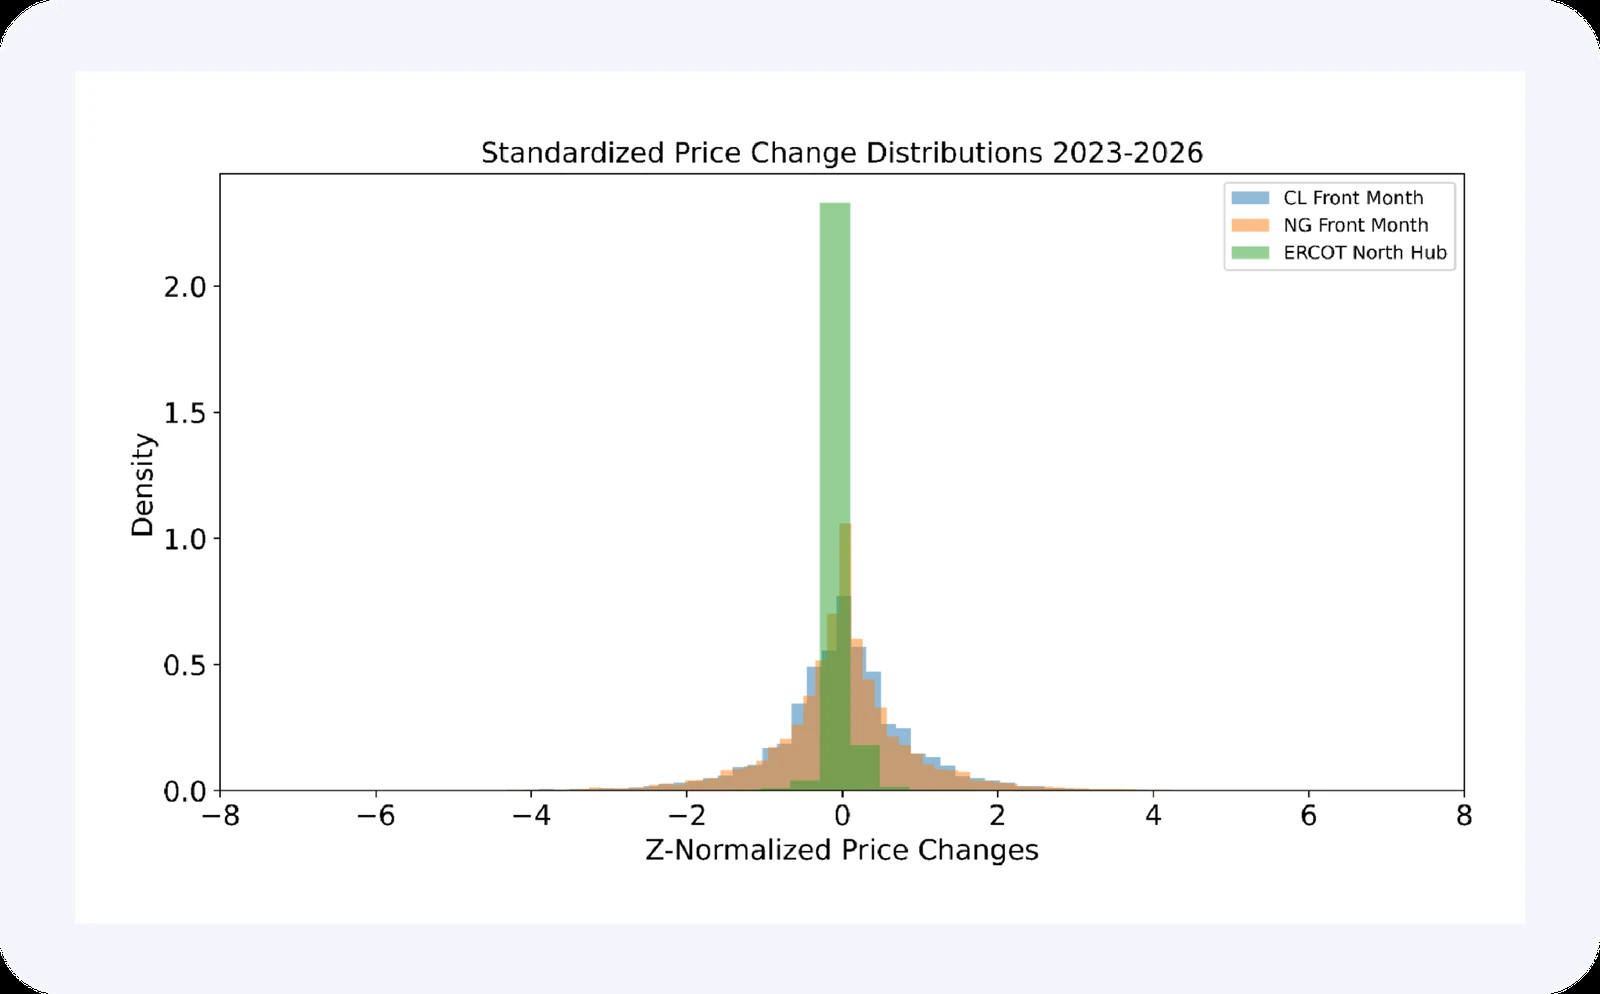
Because of the prevalence of negative and zero pricing in spot power, this analysis explores return-like profiles using the change in price, rather than filtering the sample to calculate simple or log returns or transforming it away from interpretable dimensions. ERCOT North Hub's real-time hourly price change distribution exhibits a remarkably higher kurtosis than that of crude oil or natural gas. To compare the shape of price movements directly across markets with different units and price levels, the chart below standardises hourly price changes to z-scores and overlays all three. What is immediately clear is the leptokurtic nature of ERCOT North Hub's pricing.
| CL ΔP ($/bbl) | NG ΔP ($/MMBtu) | ERCOT North Hub ΔP ($/MWh) | |
|---|---|---|---|
| Mean | −0.002 | 0.000 | 0.000 |
| Std. dev. | 0.291 | 0.020 | 113.020 |
| Min | −3.020 | −0.190 | −3,704.650 |
| 25th percentile | −0.120 | −0.008 | −2.742 |
| 50th percentile | 0.000 | 0.000 | −0.163 |
| 75th percentile | 0.120 | 0.008 | 2.538 |
| Max | 4.360 | 0.222 | 3,295.015 |
| Skew (dimensionless) | −0.310 | 0.200 | −2.660 |
| Kurtosis (dimensionless) | 12.545 | 8.404 | 456.560 |
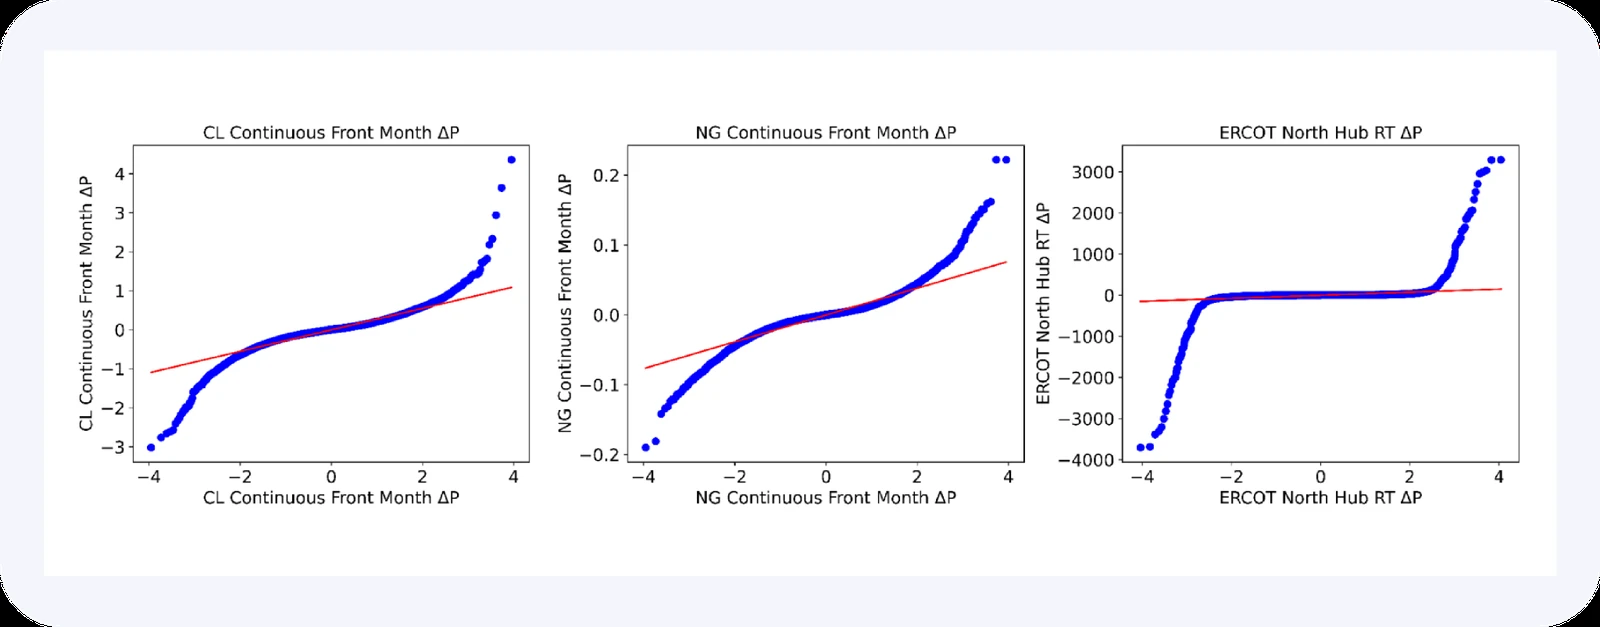
While most flat-price instruments demonstrate return profiles with fat tails, the kurtosis of spot ERCOT North Hub power appears to come from an entirely different family of numeric process. The QQ plots below compare the empirical distribution of hourly price changes against a theoretical normal; departures from the diagonal indicate tail behaviour that conventional risk measures, built on normality assumptions, will systematically understate. The convexity and concavity of ERCOT North Hub's plot is dramatically steeper than those of CL and NG.
Interestingly, given the width of ERCOT North Hub's standard deviation, the table below shows a greater number of 1- to 3-sigma price changes in CL and NG than in ERCOT North Hub across the sample — but the count of extreme 5- and 10-sigma events in the ERCOT North Hub series significantly outnumbers those of CL and NG.
| Market | Threshold | Sample count | Sample frequency |
|---|---|---|---|
| CL | σ | 3,772 | 0.212735 |
| CL | 2σ | 963 | 0.054312 |
| CL | 3σ | 288 | 0.016243 |
| CL | 5σ | 46 | 0.002594 |
| CL | 10σ | 4 | 0.000226 |
| NG | σ | 3,488 | 0.196718 |
| NG | 2σ | 1,028 | 0.057978 |
| NG | 3σ | 352 | 0.019852 |
| NG | 5σ | 48 | 0.002707 |
| NG | 10σ | 2 | 0.000113 |
| ERCOT North Hub | σ | 359 | 0.013740 |
| ERCOT North Hub | 2σ | 220 | 0.008420 |
| ERCOT North Hub | 3σ | 169 | 0.006468 |
| ERCOT North Hub | 5σ | 114 | 0.004363 |
| ERCOT North Hub | 10σ | 63 | 0.002411 |
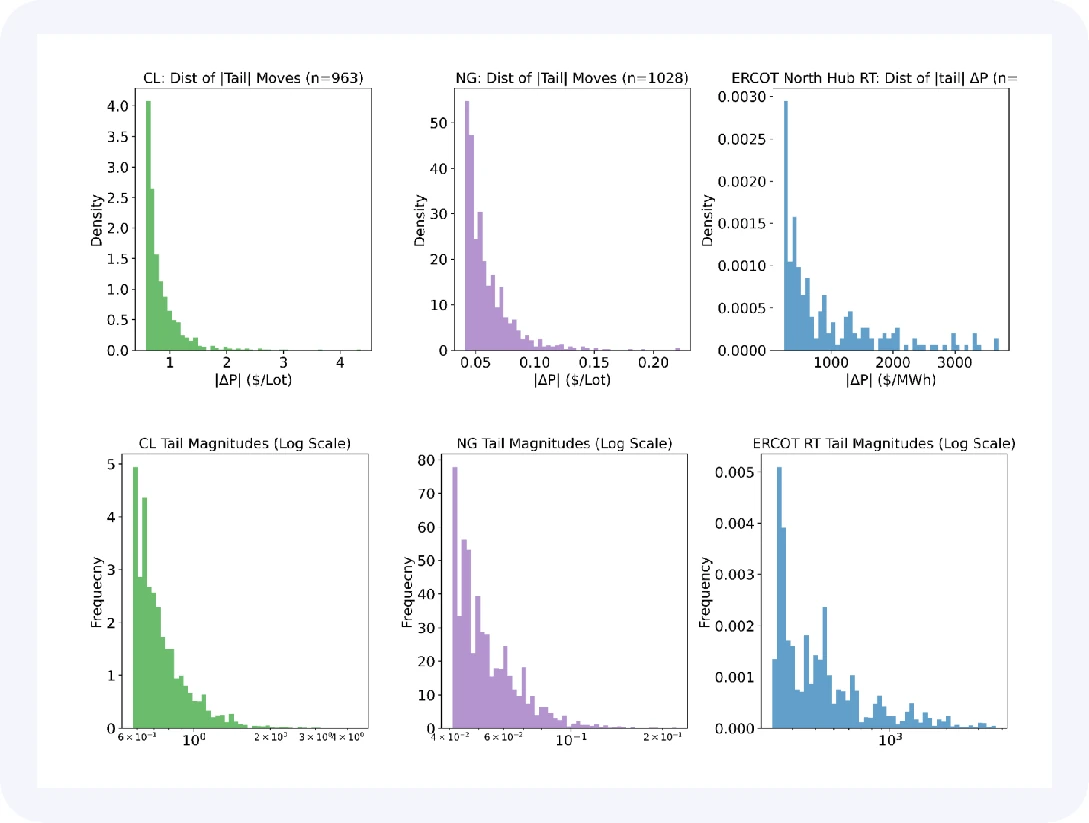
The frequency of extreme moves is only half the picture. The magnitude of those notional price changes, once they occur, is equally asymmetric. The charts below show the distribution of tail event sizes — price changes exceeding two standard deviations — for each market.
A natural question follows: is this price movement uniformly distributed across months, given that it is not uniformly distributed across hours ending — or does it concentrate in identifiable windows? The answer has significant implications for how a trading operation would be structured.
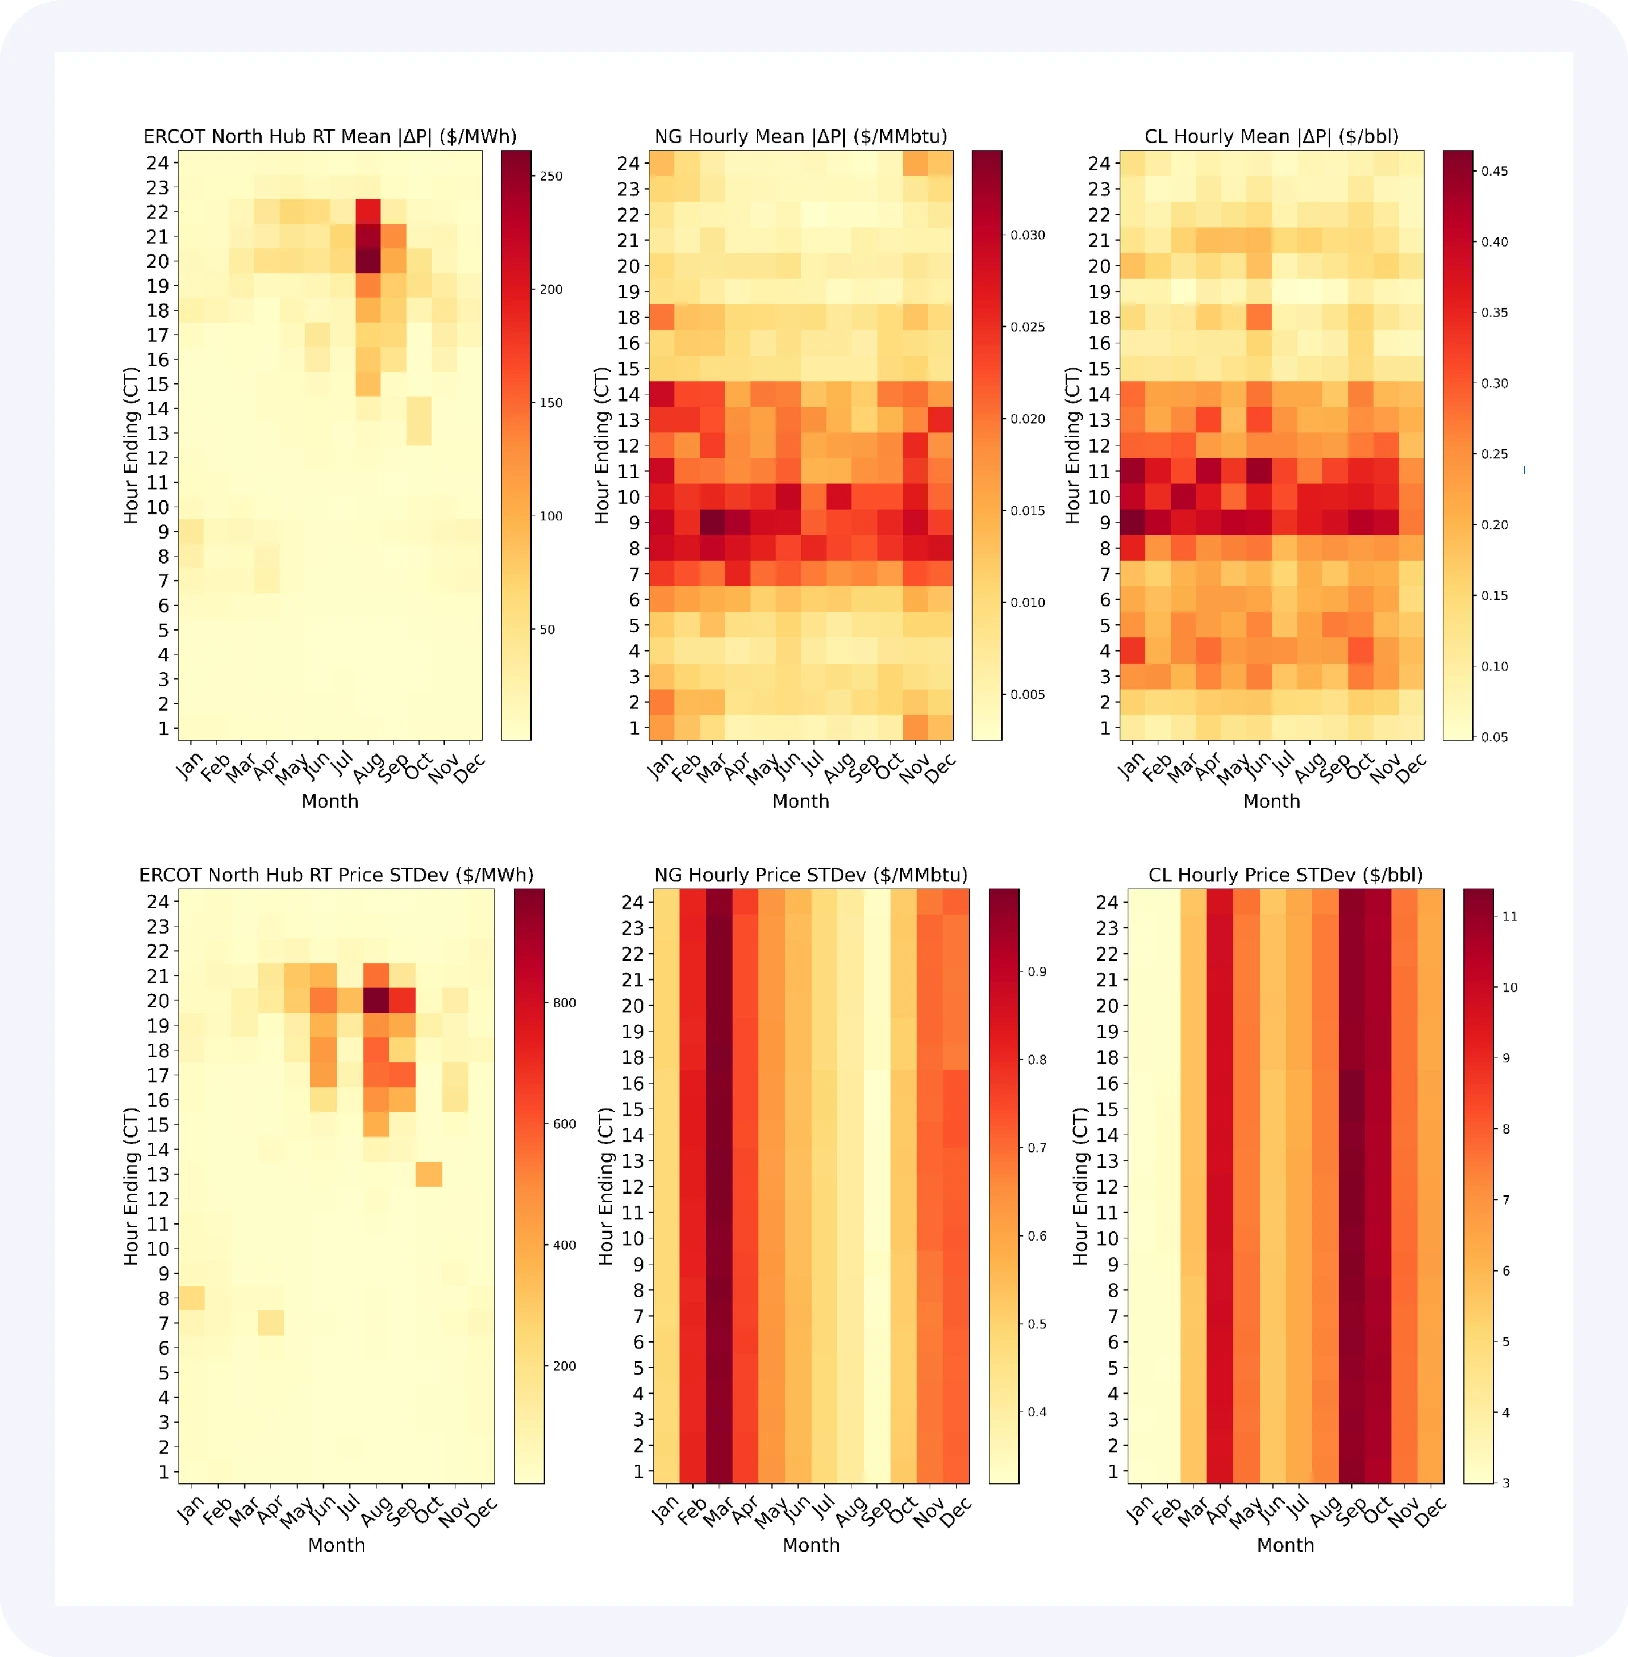
Average price action across months reveals that price movement, across months as across hours, is not uniformly distributed over the three-year sample. Decomposing to the hourly level confirms concentration. The charts below show the average absolute price change and the standard deviation of prices by hour ending. In crude oil and natural gas these profiles are relatively flat, consistent with volume-driven markets where participation, not physics, determines the rhythm. In ERCOT, both measures peak sharply during the evening ramp hours, when declining solar generation meets sustained cooling demand.
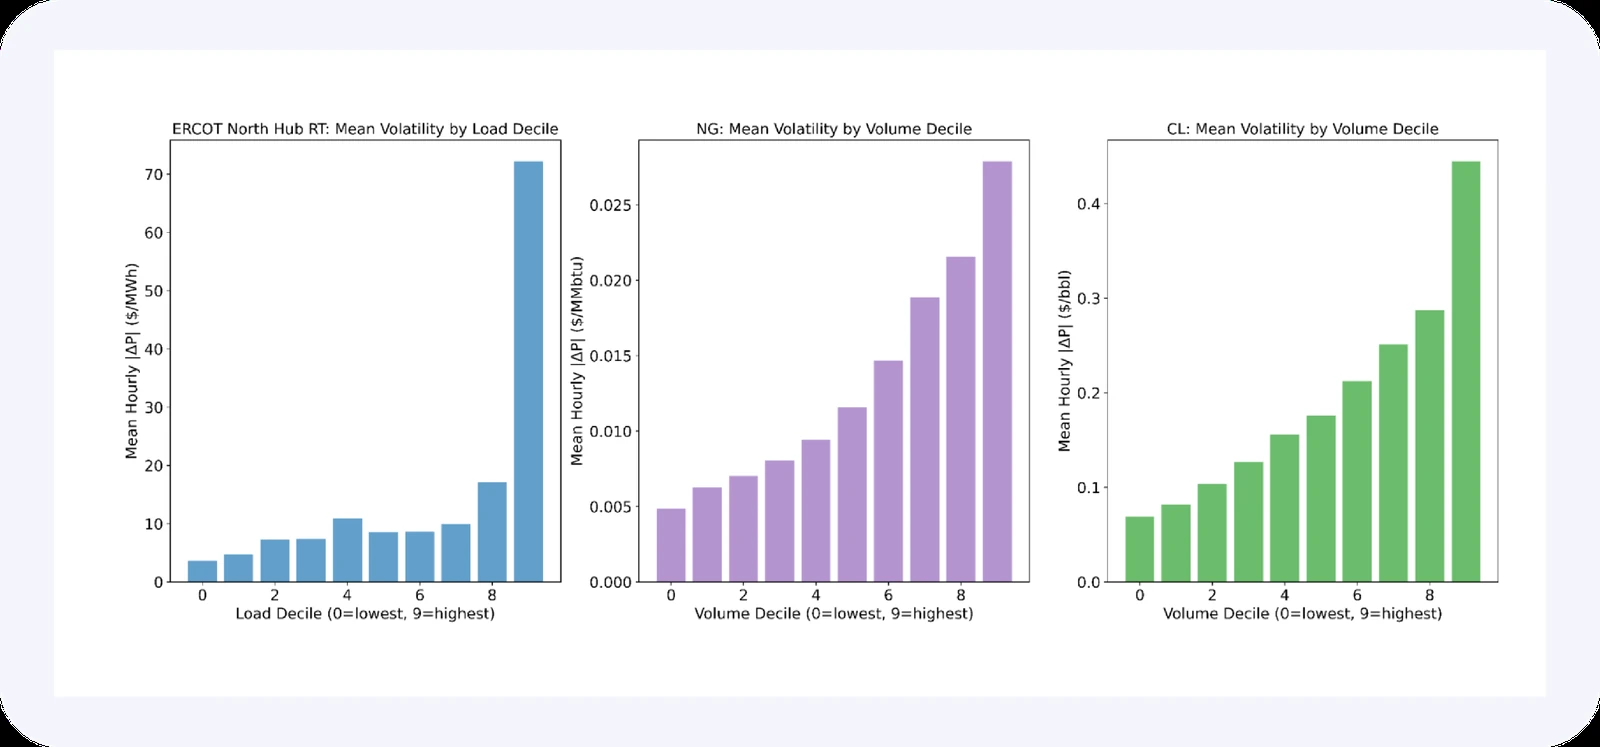
Critically, the timing and magnitude of these moves are not random. The charts below show mean absolute price change as a function of system load for ERCOT, and as a function of trading volume for crude and natural gas. In ERCOT, load — which can be forecast with high accuracy from weather data — is clearly a strong predictor of move magnitude. The equivalent relationship in crude and natural gas is similar, with volatility increasing with volume, but is not nearly as convex in tail events. Given the stability of expected load profiles, when realised load differs significantly from expectation, prices move significantly.
Aggregating across all hours, days, and seasons, the total annual absolute price movement per unit of exposure provides one summary measure of how much each market moves:
- CL: $1,129/bbl ($1,129,000 per lot on NYMEX)
- NG: $76.96/MMBtu ($769,600 per lot on NYMEX)
- ERCOT North Hub: $130,943/MWh ($130,943 per lot on ElectronX)
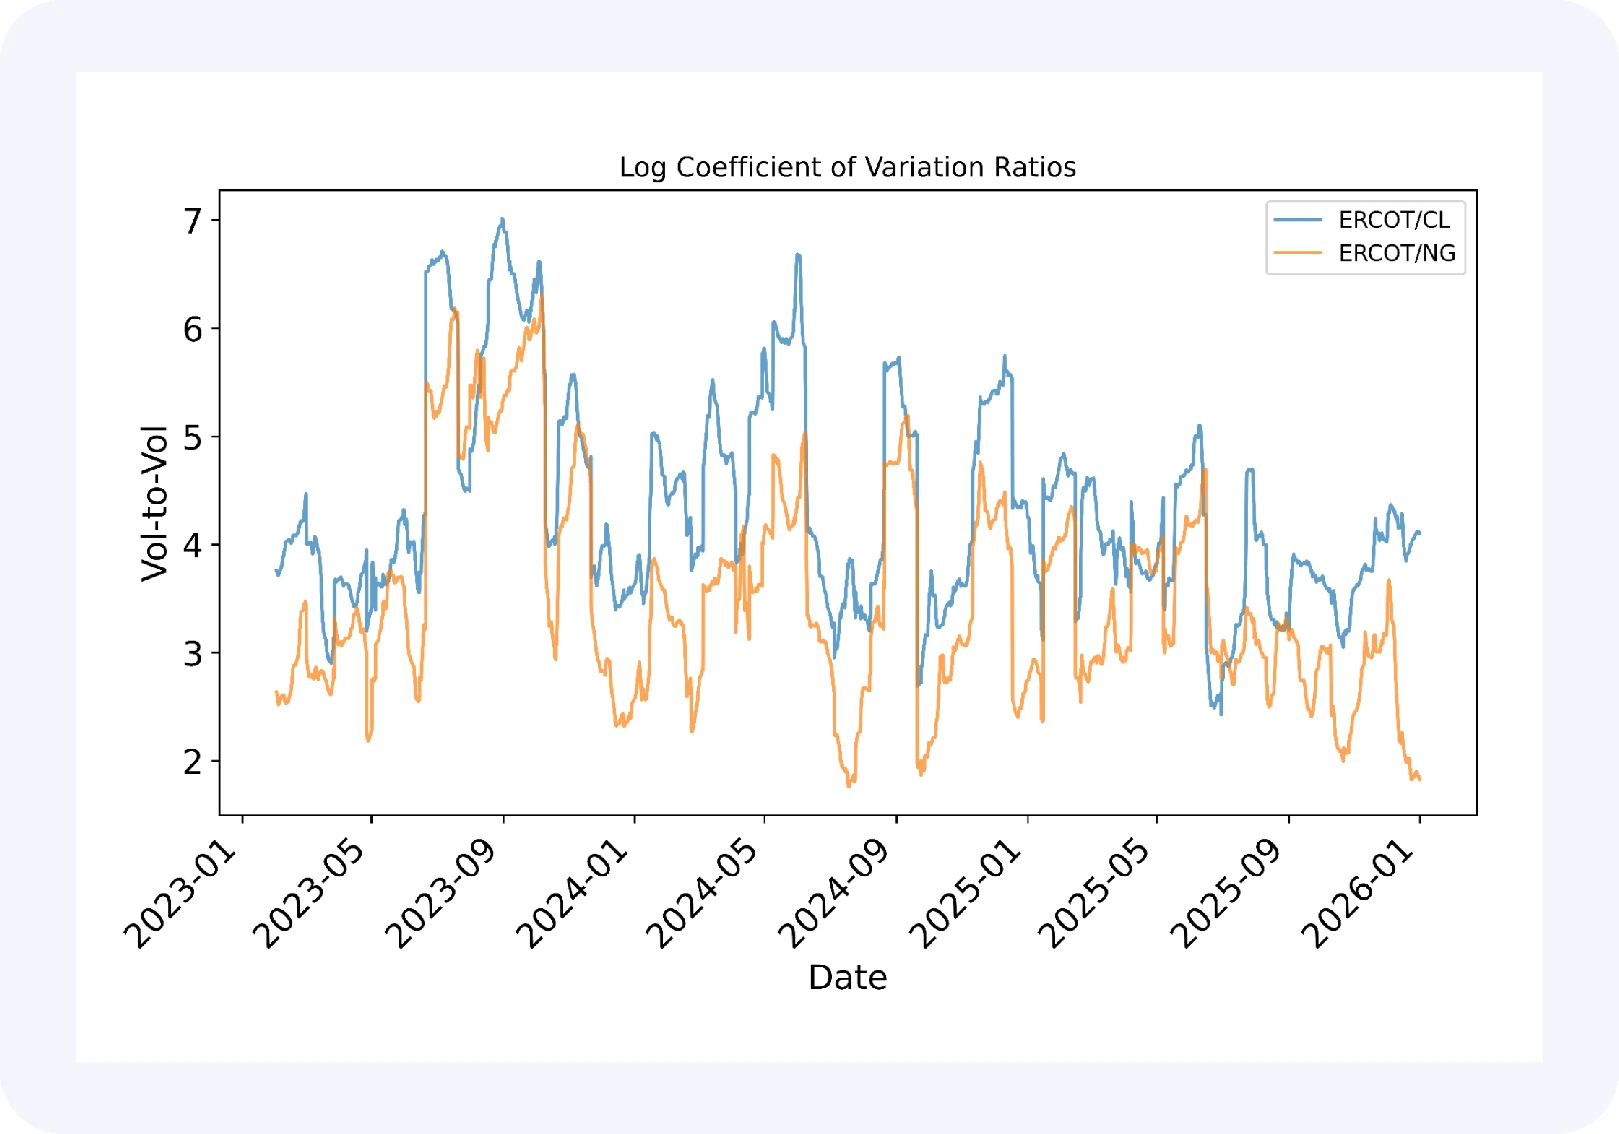
From only a single hub, of dozens across the spot market, this aggregate movement illustrates the scale of price variability in US power markets. Adjusted for price, the volatility in US power is large and persistent relative to crude and natural gas.
The solution: the ElectronX advantage
Precision exposure
Existing power derivatives instruments offer rough, long-term exposures across large aggregate pricing regions, and can only clumsily mitigate the risk of the short-term volatility explored above. To directly serve hedgers who want to minimise tracking error against their intraday shape risk, ElectronX is the first power derivatives exchange to offer hourly contracts for more flexible exposure to short-duration load, weather, and infrastructural risks — saving them from unnecessary, expensive, longer-dated hedges. These granular contracts likewise afford speculative traders targeted access to the same dynamics as directly as possible.
Bounded products
The remarkable volatility on offer in wholesale power markets is, as always, a double-edged sword and a respectable risk to be wary of when assessing return profiles. The three-year sample showed a maximum hourly change in price for ERCOT's North Hub real-time market greater than $3,000/MWh; exposure to such an extreme move at size would undoubtedly be costly. To help traders explicitly manage tail risk, ElectronX offers a suite of bounded derivatives with different price ranges suited to specific spot market conditions and risk tolerances. Standard products offer tight tradable ranges in accordance with stable, low-volatility regimes or for the most risk-sensitive traders, with expanded and extreme ranges available encompassing the full width of RTO-permissible pricing for more volatile conditions, greater risk appetites, or more expensive physical bases.
Latency sensitivity
Unlike established derivatives markets, dominated by extremely deterministic hardware footprints — UDP multicast, binary exchange protocols, acres of colocation racks, and expensive radio-frequency engineering — ElectronX offers a cloud-native trading platform driven by TCP/IP, without colocation offerings. Network latency variability serves as a natural equaliser, while strict message rate limits and proactive surveillance work to deter manipulative matching engine strategies.
To learn more, reach out to sales@electronx.com.