PJM: Beyond Western Hub
A guide to price formation across Dominion, Eastern Hub, N Illinois Hub, AEP-Dayton Hub, and the MISO and South interties
Western Hub has long served as the benchmark pricing point for PJM Interconnection traders. Yet the grid has changed dramatically in the decades since Western Hub established that dominance in liquidity, and change is accelerating: data center load growth, offshore wind build-out, nuclear retirements and restarts, coal closures, and shifting gas infrastructure have created structural price dislocations across the footprint that dwarf what any single hub can capture. Dominion Zone, Eastern Hub, N Illinois Hub, AEP-Dayton Hub, and the MISO and South interties each exhibit distinct price-formation dynamics relevant to hedging and analysis.
Overview
PJM Interconnection is the largest competitive wholesale electricity market in North America, spanning 13 states and the District of Columbia and serving approximately 65 million customers. Its real-time and day-ahead markets clear thousands of pricing nodes simultaneously using Locational Marginal Pricing (LMP) — a three-part price comprising system energy, congestion, and line-loss components.
This nodal architecture means prices are not uniform across the footprint. Two generators separated by a congested transmission line can see wildly divergent LMPs even in the same hour. These spatial price differentials, commonly expressed as basis or spread, are a defining feature of nodal power markets.
ElectronX lists bounded futures and binary options across seven PJM locations: four hubs, two interface pricing points, and one load zone. Western Hub, Eastern Hub, AEP-Dayton Hub, N Illinois Hub, MISO, South, and Dominion Zone together represent a geographically diverse set of locations that are among the most liquid in the native PJM market. The current ElectronX suite represents roughly 25% of all traded Increment Offer (INC) and Decrement Bid (DEC) volume in PJM across 2024 and 2025.
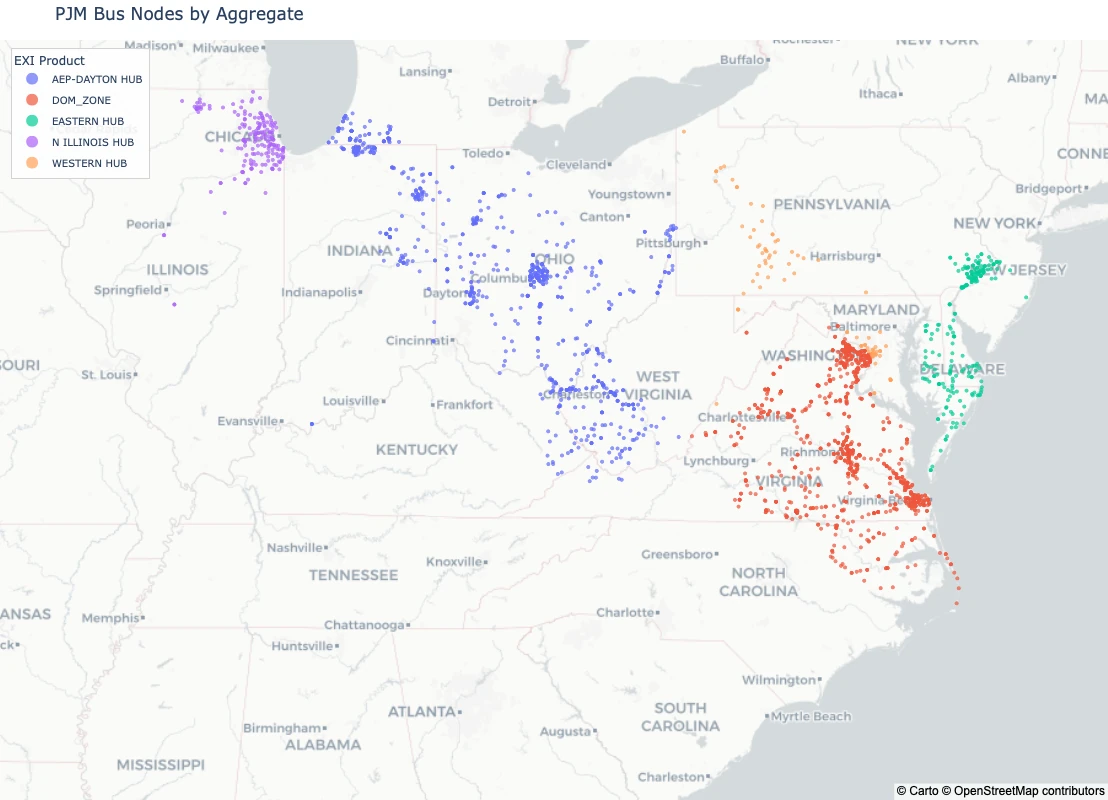
| Pricing Point | Type | Geography | Primary Use |
|---|---|---|---|
| Western Hub | Hub | Western PA / OH border | Benchmark, generation hedge |
| Eastern Hub | Hub | Eastern PA / NJ / MD | Load hedge, wind basis |
| N Illinois Hub | Hub | Northern Illinois (Chicago) | Gas/nuclear spread, data centers |
| AEP-Dayton Hub | Hub | Ohio / West Virginia | Coal-to-gas transition |
| Dominion Zone | Zone | Virginia / North Carolina | Data center load, offshore wind |
| South Interface | Interface | PJM southern border (TVA/Duke) | Import/export spread, high SE load |
| MISO Interface | Interface | Indiana/Illinois seam | Cross-market basis, wind import |
Hubs versus zones: what are you actually trading?
PJM defines two classes of aggregated pricing point. Load Zones represent a weighted average of all nodes within a utility service territory and reflect load-side price exposure. Hubs are trade-defined aggregations of generation nodes designed to produce a stable, liquid reference price. The two paradigms serve different hedging purposes and can be used in combination.
What is an interface?
While hubs and zones describe pricing points inside PJM, interfaces describe pricing at PJM's external borders, where its transmission network connects to a neighbouring balancing authority operating under different market rules — or none at all. The relevant neighbours here are TVA and Duke Energy Carolinas/Progress to the south, and MISO to the west.
An interface price is calculated at the PJM boundary node. Like any LMP it has three components: energy, congestion, and marginal losses. The loss component is where interfaces become more complex, because marginal losses are directionally asymmetric — importing power onto PJM's network at a boundary costs differently than exporting off it, so import and export do not clear at the same price. That is not a market design error; it is the physics of a loaded transmission network.
When the interface is uncongested, import and export prices converge and interface basis is small. When it congests, the two diverge sharply. Critically, PJM cannot redispatch a TVA hydro unit or a MISO wind farm to relieve it — the relief valve is in someone else's control room. Interface congestion is therefore stickier than internal congestion, which translates into persistent, recurring basis structures.
Western Hub: the legacy benchmark
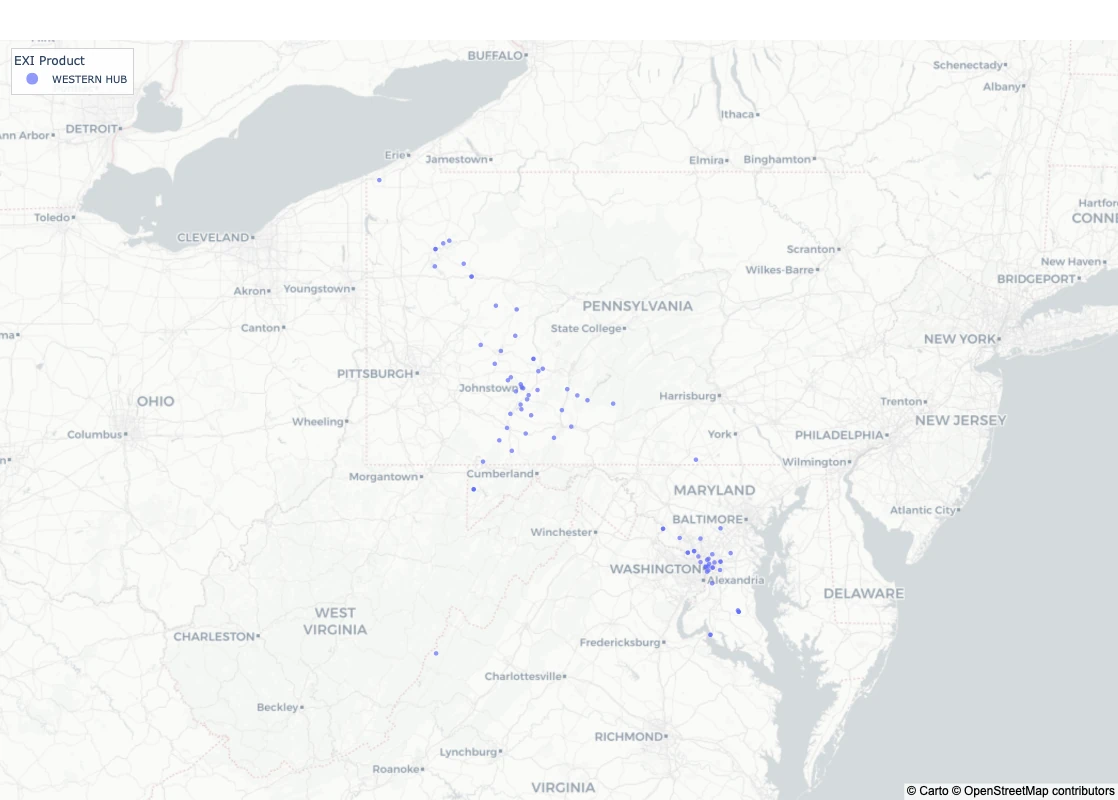
Western Hub earned its primacy organically. In the late 1990s and early 2000s, PJM's generation stack was heavily concentrated in the western portion of the footprint — Appalachian coal, Ohio gas plants, and Pennsylvania nuclear all dispatching into a grid that flowed electricity eastward toward load, historically along the I-95 corridor from North Jersey through Philadelphia and Baltimore to DC. Western Hub sat at the electrical centre of gravity for that supply-heavy western region and became the default reference price for both physical and financial contracts. Its liquidity advantages reinforced themselves: as more participants indexed to Western Hub, bid-ask spreads tightened, open interest in exchange-traded PJM Western Hub futures grew, and the hub became self-perpetuating as the dominant benchmark. For many years, trading Western Hub was simply synonymous with trading PJM — and even US power.
Why Western Hub no longer tells the whole story
The structural shift away from Appalachian coal as the marginal fuel has fundamentally altered the physics underpinning Western Hub's relevance. As cheap Marcellus and Utica shale gas displaced coal on the dispatch stack, the price-setting logic of western PJM changed. At the same time, load growth migrated dramatically eastward and southward — precisely to the zones and hubs covered here.
Some key structural shifts since 2010:
- Over 35 GW of coal retired from PJM, concentrated in Ohio, West Virginia, and Pennsylvania (EIA Today in Energy).
- Northern Virginia data center load surpassed 4 GW and continues growing at 20%+ annually (CBRE, 2025).
- The Illinois nuclear fleet repriced under Zero Emission Credits, altering N Illinois basis structures.
- Capacity market (RPM) prices are now bifurcating sharply between eastern and western zones.
These changes mean Western Hub increasingly reflects a narrow slice of PJM — the remaining generation heartland — while the price action, congestion events, and structural basis moves are happening elsewhere.
Dominion Zone: "Data Center Alley"
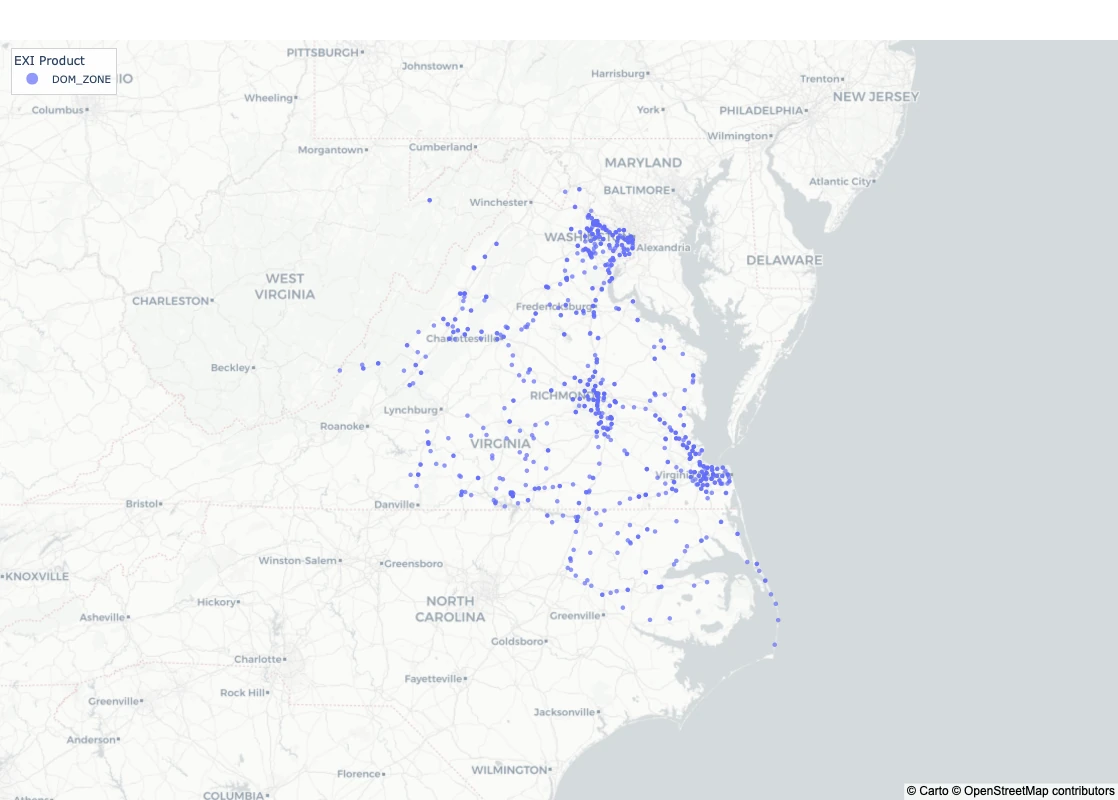
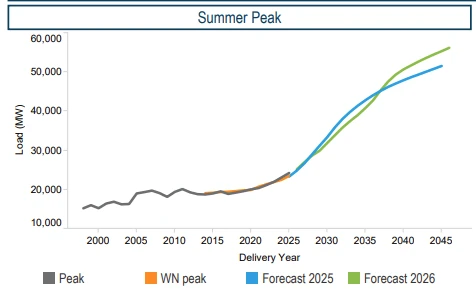
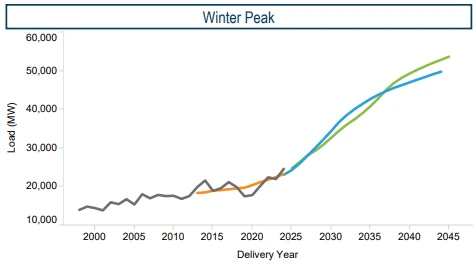
No single story in North American power markets over the past decade rivals the transformation of Northern Virginia into the world's largest data center market. Loudoun County alone hosts over 300 data centers, and the footprint continues expanding southward along the I-95 corridor. This load is unlike any other on the grid: dense, inflexible, location-constrained, and growing at a pace transmission infrastructure is struggling to match. By 2046, PJM forecasts a nearly 173% increase in Dominion load (PJM 2026 Load Forecast Report).
Load growth as a structural price driver
Data center operators require guaranteed uptime and sign long-term PPAs, creating a persistent, inelastic demand signal that does not respond to price. When generation or transmission is constrained into Northern Virginia, Dominion Zone LMPs spike sharply. The basis versus Western Hub has historically traded at a discount off-peak when power flows freely eastward, but that relationship inverts with increasing frequency during peak periods as congestion bites on key 500 kV interfaces.
PJM forecasts Dominion load to nearly triple over the next twenty years.
New offshore wind and transmission build
Virginia's CVOW project (2.6 GW at full build) and a pipeline of additional offshore projects will inject zero-marginal-cost generation near the Dominion Zone electrical boundary. Transmission constraints will determine how much actually reaches where it is needed versus being curtailed or flowing southward. Dominion Zone basis will reflect these congestion dynamics as projects come online through the late 2020s.
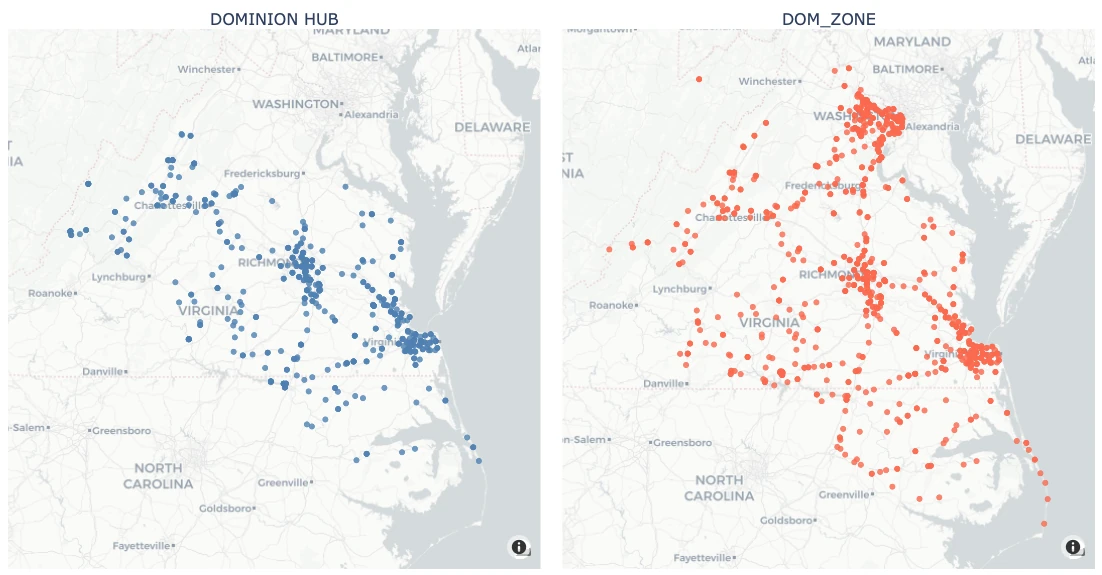
Dominion Zone vs Dominion Hub
Dominion Hub (left) represents mid- and southern Dominion and notably does not include Data Center Alley; Dominion Zone (right) includes exposure to the whole footprint.
Price dynamics
Several recurring patterns shape hourly prices in the Dominion Zone. When a Northern Virginia heat forecast of roughly 95°F or higher appears in the three-to-five-day window, congestion into the zone builds and the day-ahead market tends to clear a congestion premium in the affected peak hours. When CVOW runs near capacity against light overnight load, zero-marginal-cost output into a constrained export path tends to depress local overnight prices. On high-solar days, Virginia solar suppresses midday prices (roughly HE11–HE14) while the late-afternoon peak (roughly HE17–HE19) rises as solar output fades. This midday-to-afternoon spread, often described as the duck curve, has widened as solar capacity has grown and is most pronounced in the spring and autumn shoulder periods.
Eastern Hub: PJM's nuclear baseload
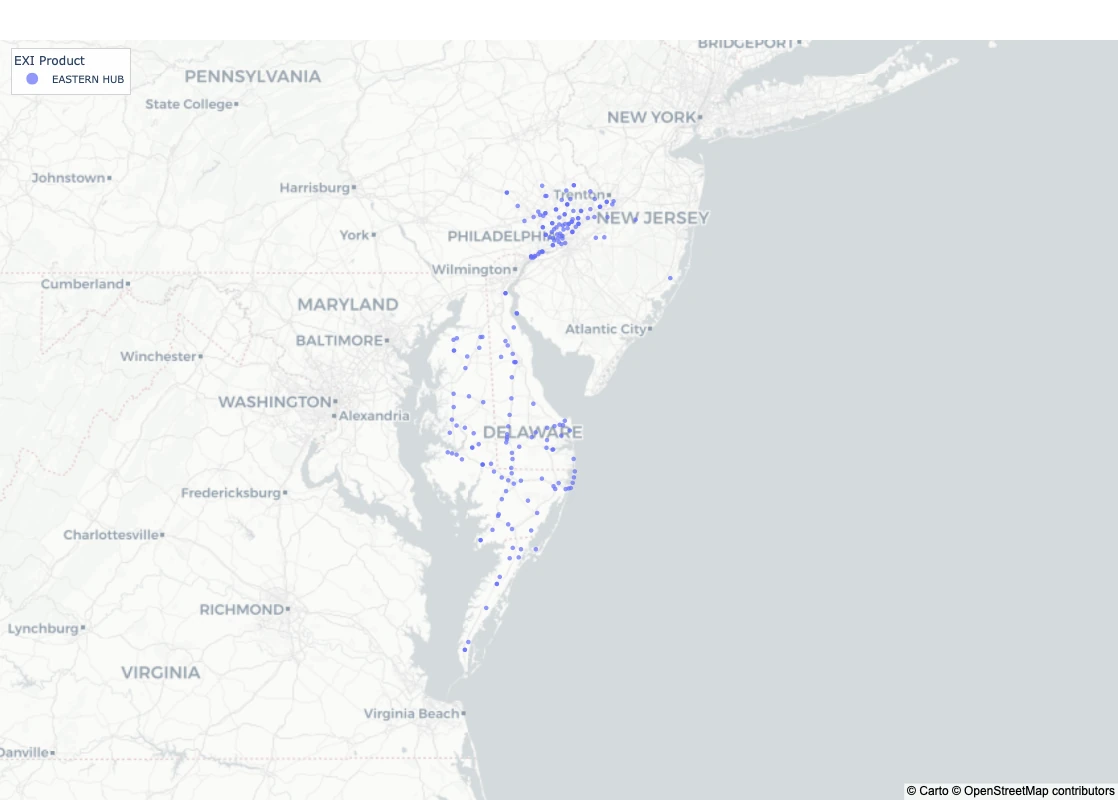
Eastern Hub aggregates generation nodes across eastern Pennsylvania, New Jersey, Delaware, and Maryland — the gateway between PJM's generation heartland and the dense load centres of the Mid-Atlantic coast. It sits at the intersection of multiple structural forces: legacy nuclear plants, aggressive offshore wind development, pipeline-constrained natural gas markets, and load centres with limited local generation.
Nuclear baseload
Eastern Hub pricing has long been anchored — and suppressed — by the baseload output of the region's nuclear fleet, most notably Salem/Hope Creek (PSEG) in New Jersey and Peach Bottom in southeastern Pennsylvania. These units are price-takers that depress day-ahead prices during periods of low load. Their retirement timeline and any outage events create sudden, sharp basis widening relative to Western Hub.
The dynamics are asymmetric: nuclear retirements remove a chronic price suppressor, lifting the floor on Eastern Hub basis, while unplanned outages temporarily tighten supply and spike real-time prices. The two scenarios affect Eastern Hub basis differently — one structural, one tactical.
Upcoming offshore wind projects
The Atlantic Shores, Atlantic Winds, and SunEnergy offshore portfolios, collectively representing tens of gigawatts for New Jersey, Maryland, and Delaware, will interconnect into the Eastern Hub electrical neighbourhood. The grid reinforcement needed to absorb this generation is still being planned. Added to an already robust local nuclear baseload, this is likely to create pronounced oversupply conditions, driving real-time Eastern Hub prices steeply negative during high-wind, low-load windows — typically spring overnights and mild weekend afternoons.
Price dynamics
Eastern Hub prices respond to regional renewable output and to north-south congestion. When overnight regional wind is forecast above roughly 80% of capacity, the overnight hours most exposed to oversupply tend to soften. On clear spring and autumn days, New Jersey and Pennsylvania solar is large enough to suppress midday prices (roughly HE11–HE14). Separately, periods of light load in Pennsylvania, New Jersey, and Delaware can leave excess nuclear generation in the north while cooling and data center load in Dominion, combined with outages in northern Maryland, tighten the system to the south. The resulting north-to-south congestion is a recurring driver of the Eastern Hub to Dominion price relationship.
N Illinois Hub: cheap power (for now)
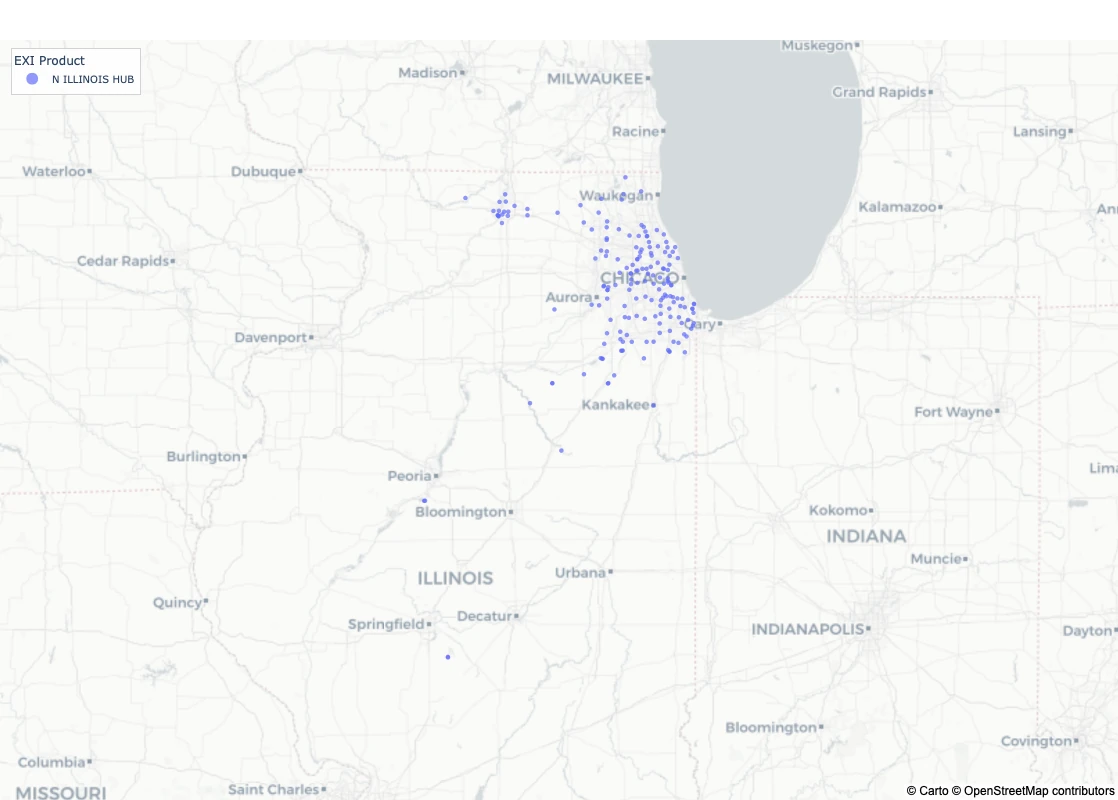
Northern Illinois Hub occupies one of the most structurally interesting positions in North American power markets. Chicago sits at the centre of Midwestern wind resources, Constellation's nuclear fleet, LNG-supplemented natural gas infrastructure, and rapidly growing data center load. The result is a pricing point with dynamics unlike any other in PJM, and with an active interface to MISO that links its price formation across the seam.
Constellation's nuclear fleet
Constellation operates the largest nuclear fleet in the United States, with Braidwood, Byron, Dresden, Quad Cities, and Clinton all dispatching into the N Illinois market — 9.1 GW of zero-marginal-cost baseload combined. This supply concentration has a profound effect on N Illinois Hub pricing: it depresses the off-peak floor, reduces price volatility relative to fuel-driven markets, and creates substantial contingency exposure when multiple units trip simultaneously.
Illinois' Zero Emission Credit (ZEC) programme effectively provides a price floor for these units independent of power market prices, ensuring their continued operation. The concentration also means the tail risk of a simultaneous multi-unit nuclear outage is a distinct feature of N Illinois price formation.
Wind integration & the MISO interface
Illinois sits at the eastern edge of the Great Plains wind belt. As Iowa, Illinois, and Missouri wind capacity has expanded, excess generation regularly flows into N Illinois Hub via the MISO-PJM seam. This creates recurring price dislocation events, particularly during overnight and spring periods, where N Illinois Hub real-time prices collapse to zero or below as wind floods the zone and nuclear units cannot back down.
The interface has binding transmission constraints that create persistent basis between MISO Illinois Hub and PJM N Illinois Hub. These spreads are subject to FERC convergence bidding rules and associated compliance requirements.
Data center & industrial load
Chicago's outer suburbs — Elk Grove Village, Aurora, and Naperville in particular — have emerged as the third-largest data center market in North America. That load growth, combined with heavy industrial demand from steel mills and chemical plants, creates distinct on-peak stress signatures that differ materially from Western Hub's demand profile.
Price dynamics
Northern Illinois prices are shaped by wind on the MISO seam and by the region's nuclear fleet. When overnight wind in Iowa and Illinois is strong and the MISO-PJM interface congests, Northern Illinois overnight prices tend to fall, and negative prices have occurred multiple times per year under these conditions. When multiple nuclear units in the area — Braidwood, Byron, or Quad Cities, for example — are in refuelling or unplanned outage at the same time, peak-hour prices can reprice sharply within the one-to-five-day window. On days combining strong wind with normal peak load, the within-day price range is among the widest in PJM. The cross-seam relationship between MISO Illinois Hub and PJM Northern Illinois also tends to widen when the interface binds during spring wind oversupply.
AEP-Dayton Hub: industrial transformation
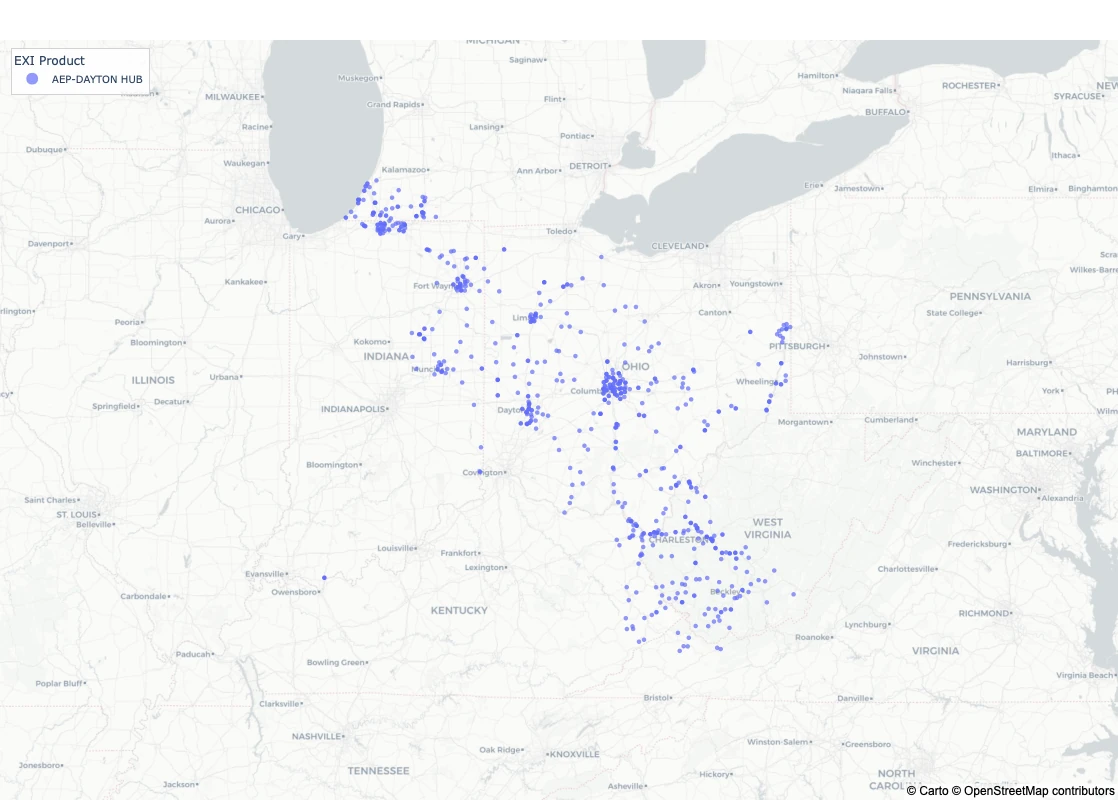
AEP-Dayton Hub covers the service territories of American Electric Power Ohio and AES Ohio across central and western Ohio. Historically one of the most coal-intensive regions in PJM, it has undergone a profound structural transformation over the past decade — and that transitional character is precisely what shapes its price formation, since markets in structural flux tend to exhibit larger and more persistent basis moves.
Coal retirements
AEP's Conesville, Amos, Mitchell, and Mountaineer plants, combined with AES Ohio's Stuart and Killen retirements, have removed thousands of MW of dispatchable thermal since 2015. AEP-Dayton has gone from net exporter to increasingly reliant on imports during peak conditions. The replacement generation — gas CTs, utility solar, and batteries — is structurally more volatile, producing larger real-time/day-ahead spreads and more frequent congestion events on import paths.
Gas infrastructure & Appalachian basis
AEP-Dayton benefits from proximity to Marcellus and Utica production via Rover, NEXUS, and Panhandle Eastern. When gas flows freely, AEP-Dayton power tracks Henry Hub-equivalent fuel costs and basis to Western Hub compresses. During cold snaps, when heating demand competes with generation, local gas prices spike above Appalachian basis, driving power price events invisible at Western Hub.
Winter Storm Elliott case overview
During December 2022's Winter Storm Elliott, AEP-Dayton Hub real-time prices diverged from Western Hub by over $500/MWh at points as gas supply disruptions hit local peaker fuel supply chains. Forward markets had priced this risk at less than $10/MWh in the weeks prior — a textbook illustration of how gas dependency can drive AEP-Dayton prices sharply away from the liquid but blunt Western Hub benchmark.
Industrial load & demand response
Ohio's heavy industrial base — auto manufacturing, steel production, chemical processing — provides a large demand response resource that actively participates in PJM's capacity and energy markets. Large price spikes at AEP-Dayton are often self-limiting as DR resources curtail, capping the upside of price events. But the frequency and magnitude of events up to that cap has been increasing as coal retirements remove firm thermal backup, producing a more volatile but capped distribution of outcomes.
Price dynamics
AEP-Dayton prices are sensitive to gas supply stress and to growing solar output. Cold-weather gas supply stress events, such as a polar vortex signature appearing in the three-to-five-day forecast, are often visible days in advance and can produce sharp real-time price spikes before the forward market reprices, as seen during Winter Storm Elliott. On high-solar days, expanding central Ohio solar deepens the midday-to-afternoon pattern, suppressing midday hours (roughly HE11–HE14) ahead of the late-afternoon ramp (roughly HE17–HE19). Large industrial demand response in Ohio tends to self-curtail ahead of expected spikes, which can cap upside in the overnight and peak hours when load softens.
South Interface
PJM's southern boundary connects to non-competitive, vertically integrated utilities: TVA, Duke Energy Carolinas, Duke Energy Progress, and Southern Company affiliates. Unlike PJM's internal hubs and zones, this border is an interface pricing point, and for much of PJM's commercial history it was traded as two distinct products — South Import (South Imp) and South Export (South Exp).
South Imp versus South Exp
In PJM's earlier market design, the southern interface was settled with separate pricing for each direction of flow. South Export reflected the price at which energy left PJM southward, with the boundary node adjusted for marginal losses flowing out. South Import reflected energy entering PJM from the south — the same boundary, but with the loss component reversed, since importing onto a loaded system incurs losses differently than exporting off it.
The result was a structural wedge between the two prices: $5 to $30/MWh or more under stressed conditions. When PJM was a net exporter south — the typical state during mild weather with abundant Mid-Atlantic nuclear and gas — South Exp was the active price and cleared at a discount to internal PJM prices. When the Southeast needed imports, during summer AC peaks or winter cold snaps, South Imp became dominant and cleared at a large premium as congestion drove up the component.
A unified interface
Over time, FERC and PJM moved toward unified interface settlement, partially collapsing the explicit Import/Export distinction. The underlying physics remained. The South Imp/Exp dynamic migrated into Dominion Zone basis: when the interface congests in the import direction, Dominion Zone prices rise versus Western Hub — the modern expression of South Imp. When PJM exports freely south, Dominion Zone basis compresses, the legacy of South Exp. The product has changed; the fundamental physics has not.
TVA, Duke Carolinas & supply-side dynamics
TVA operates a diverse fleet across Tennessee of mostly coal, nuclear, hydro, and gas. Its surplus or deficit position fluctuates significantly with hydrology — Norris, Kentucky, and Cumberland reservoir levels — and with nuclear availability at Watts Bar, Sequoyah, and Browns Ferry. Wet years with good hydrology push TVA surplus northward into PJM, suppressing Dominion Zone prices and keeping the South Exp analogue dominant.
Duke Energy Carolinas and Duke Energy Progress operate McGuire, Catawba, Brunswick, Harris, and Robinson — substantial zero-marginal-cost baseload. When Duke's nuclear units enter scheduled refuelling outages, typically spring and autumn, the southeastern grid tightens and the import incentive from PJM strengthens. This refuelling cycle is observable months in advance.
The Transco pipeline
The Transcontinental Gas Pipeline (Transco), running from the Gulf Coast through the Carolinas and Virginia to New York City, is the primary fuel artery for gas-fired generation on both sides of the PJM/Southeast seam. When winter cold snaps surge heating demand across the Mid-Atlantic and Southeast simultaneously, Transco capacity becomes the binding constraint: pressure drops, interruptible service is cut, and gas peakers on both sides face identical fuel cost spikes. Both PJM Dominion Zone and southeastern markets spike together when Transco Zone 4/5 basis blows out.
Price dynamics
The South Interface price reflects the direction and intensity of flows between PJM and the Southeast. During Southeast heat events, congestion builds in the import direction and the boundary node tends to clear at a premium to internal PJM. When TVA hydro runs high against light overnight load, flows turn northward and the interface price tends to discount to internal PJM. During Transco Zone 4 and Zone 5 constraint events, gas supply stress affects both PJM and southeastern peakers at the same time, and the interface price can spike as bilateral flow volumes fall. When PJM is a net exporter to the south during mild weather, congestion accrues on the southbound path. TVA reservoir reports and Duke outage schedules are common forward-looking inputs for anticipating these patterns.
MISO Interface
PJM's western boundary with MISO is the most commercially active external seam in North American wholesale power markets. It is the crossing point for enormous Great Plains wind flows, the interface between two competing LMP designs, and the source of some of the most persistent cross-market basis structures available to participants with the infrastructure to analyse them.
Seam geography & key pricing relationships
The primary interface runs through Indiana. On the PJM side: N Illinois Hub and AEP-Dayton Hub. On the MISO side: MISO Indiana Hub and MISO Illinois Hub, the legacy "Cinergy Hub". The spread between these paired hubs is the commercial expression of the seam and one of the most traded power basis relationships in North America. PJM has historically cleared at a premium to MISO, reflecting tighter capacity margins and higher load density, but the premium compresses sharply when MISO wind floods the interface and widens during PJM shortfall events when MISO generation cannot move east fast enough.
Market design at the boundary
PJM and MISO are both nodal LMP markets but optimise their dispatch stacks independently. There is no joint security-constrained economic dispatch across the seam. Cheap MISO generation cannot automatically serve PJM load; it requires a physical schedule subject to ATC limits and scheduling deadlines that create friction and latency. FERC has estimated this coordination failure costs hundreds of millions annually in unnecessary redispatch. The seam will produce pricing dislocations as long as two separate operators independently optimise two separately bounded systems sharing a physical interface.
Wind import flows
The most structurally significant flow across the seam is Midwestern wind. Iowa, Illinois, Minnesota, and Kansas have built one of the largest wind portfolios in the world, and when conditions align — strong overnight winds, light load, a flat gas stack — generation floods the MISO network and pushes toward PJM. Interface constraints determine how much crosses; the rest collapses MISO North prices while PJM holds elevated. Spring and autumn overnights see the highest frequency of these events. The MISO Illinois / PJM N Illinois spread has exceeded $100/MWh in a single settlement interval during peak congestion hours, a sharp divergence between interface and internal-hub settlement prices.
MISO South as a distinct cross-market destination
When Entergy joined MISO in 2013, the seam's commercial reach expanded south. MISO South runs almost entirely on gas-fired generation with modest nuclear — Grand Gulf, Waterford, River Bend, and Arkansas Nuclear One. Price formation is a direct function of Henry Hub and Gulf Coast gas. LNG export terminals at Sabine Pass, Cameron, Freeport, and Corpus Christi have placed a structural floor under Henry Hub: when JKM or TTF is elevated, Gulf Coast gas rises toward the LNG netback and MISO South power prices follow. This is a global gas market linkage that no internal PJM hub reflects.
Price dynamics
The MISO Interface node reflects conditions on the western seam. When sustained overnight wind in Iowa and Illinois pushes against the seam, the interface node tends to discount as congestion builds in the import direction. Planned 765 kV maintenance outages on the key Indiana ties, published weeks in advance, reduce available transfer capability and can tighten import-constraint pricing in the one-to-five-day window. On days that combine heavy overnight MISO wind with normal daytime PJM load, the interface node price can swing substantially within the day, with a wider within-day range than most other interfaces.
Comparative analysis
While each hub and zone has its own structural story, they can also be viewed together as a set of distinct factor exposures — data center load growth, nuclear generation, renewable integration, and gas infrastructure — each of which behaves differently from the blunt and increasingly unrepresentative Western Hub benchmark.
Structural price factors
Beyond hour-to-hour drivers, several structural factors shape these hubs over longer horizons. Continued data center load growth in Northern Virginia is a persistent driver of Dominion Zone basis relative to Western Hub. Nuclear outage events in Northern Illinois introduce recurring price sensitivity that does not depend on which specific unit is affected or exactly when. Cold weather and pipeline constraint events tend to affect the Appalachian-adjacent generation fleet disproportionately, a recurring driver of AEP-Dayton winter basis. These describe how prices tend to behave and are not trading recommendations.
Hedging applications for commercial participants
For commercial hedgers, these hubs often provide more precise instruments than Western Hub. A utility serving Northern Virginia is exposed to Dominion Zone LMPs rather than Western Hub, so its basis to Western Hub is itself a significant source of risk. Similarly, a large industrial load in Ohio is better served by AEP-Dayton hedges that reflect its actual supply stack exposure.
Renewable developers connecting into the eastern PJM or Illinois grid need hub-specific merchant tail hedges that reflect where their generation will actually clear. Western Hub hedges leave them exposed to basis risk that can be as large as the merchant price risk they are attempting to hedge in the first place.
Risk considerations
Trading beyond Western Hub introduces specific risks that require purpose-built risk management frameworks. These are not reasons to avoid these markets; they are reasons to approach them with appropriate analytical infrastructure and position sizing.
Liquidity risk
Western Hub's liquidity advantage is real. ElectronX's other products — while they offer distinct exposures Western Hub does not — are thinly traded for the time being on ElectronX and other power futures markets, despite being liquid on the RTO. The MISO and South interties were in fact more liquid than Western Hub in 2025 across virtual transactions in other power futures markets. The current ElectronX suite represents roughly 25% of all traded Increment Offer (INC) and Decrement Bid (DEC) volume in PJM across 2024 and 2025.

Model risk
The structural stories described here are genuine, but they require sophisticated LMP dispatch modelling to quantify. Relying on historical basis alone without forward-looking generation and transmission modelling will produce stale signals, particularly given the pace of asset retirements and renewable additions across the PJM footprint.
Regulatory risk
PJM tariff changes, FERC order compliance, state-level renewable mandates, and capacity market design reforms can rapidly alter the structural fundamentals of any given hub. The Illinois ZEC programme and Virginia's Clean Economy Act are examples of state policy creating lasting market structure changes — but policy can also reverse or be modified. Positions with multi-year tenors must carry regulatory scenario analysis as a first-class risk.
Basis convergence risk
Structural basis relationships can remain dislocated far longer than expected and then converge violently as transmission investments clear congestion. The history of power market basis trading includes extended periods of profitable carry followed by sudden convergence that wipes out accumulated gains. Position sizing must respect this path dependency, and stop-loss disciplines specific to each hub's fundamental catalysts should be defined before entry.
Conclusion
Western Hub is not wrong; it remains a deep, liquid, and important pricing point for any PJM participant. But it is insufficient. The grid has diversified, load growth has shifted, the generation stack has transformed, and the structural dynamics that made Western Hub the centre of PJM's commercial gravity no longer apply across a footprint that now stretches from Illinois to North Carolina.
Dominion Zone offers a data center load premium and offshore wind integration story unmatched anywhere else in the eastern interconnection. Eastern Hub sits at the confluence of nuclear optionality, offshore wind disruption, and pipeline gas constraints. N Illinois Hub provides access to the nuclear-renewable interaction dynamics of the Chicago market and the complex MISO seam. AEP-Dayton Hub captures the ongoing coal-to-gas transition with its attendant winter basis and industrial volatility signatures. The MISO and South interfaces offer wholly different fundamentals and price profiles than hubs and load zones.
Participants who confine their PJM activity to Western Hub may be accepting basis risk they have not fully quantified. The set of pricing points beyond Western Hub reflects a broad range of the structural dynamics now shaping North American power markets.